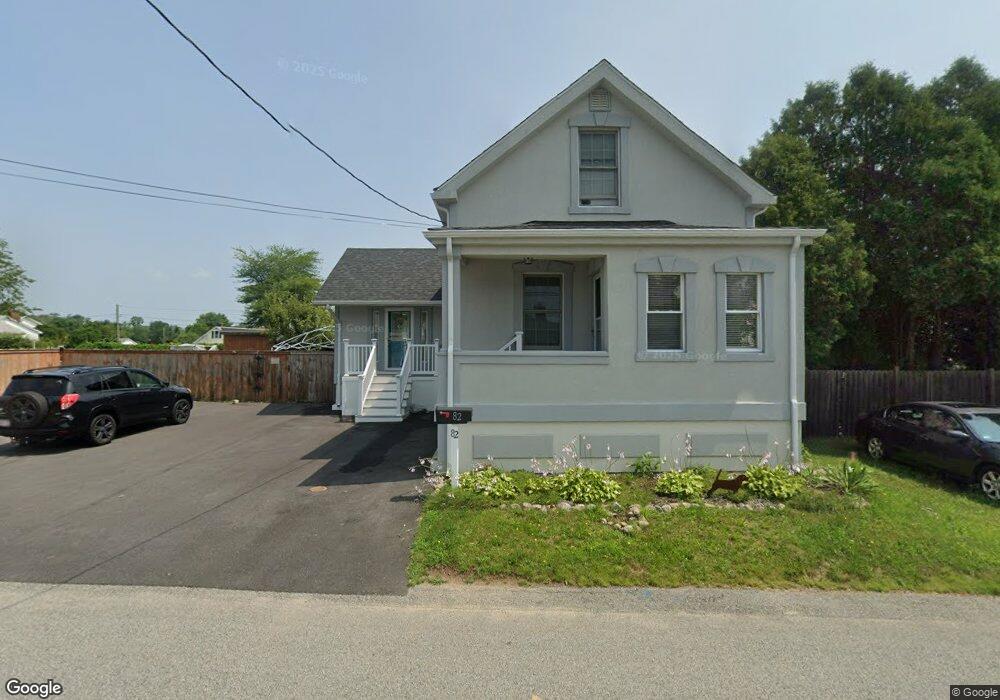
82 Center St South Dartmouth, MA 02748
Bliss Corner NeighborhoodEstimated Value: $407,000 - $423,606
3
Beds
1
Bath
985
Sq Ft
$421/Sq Ft
Est. Value
About This Home
This home is located at 82 Center St, South Dartmouth, MA 02748 and is currently estimated at $414,902, approximately $421 per square foot. 82 Center St is a home located in Bristol County with nearby schools including Dartmouth High School and St. Teresa of Calcutta School.
Ownership History
Date
Name
Owned For
Owner Type
Purchase Details
Closed on
Oct 2, 2006
Sold by
Reilly Frances V and Reilly Thomas W
Bought by
Brum Gina and Brum John
Current Estimated Value
Home Financials for this Owner
Home Financials are based on the most recent Mortgage that was taken out on this home.
Original Mortgage
$180,000
Interest Rate
6.52%
Mortgage Type
Purchase Money Mortgage
Purchase Details
Closed on
May 2, 2002
Sold by
Costa James J
Bought by
Reilly Thomas W and Reilly Frances
Purchase Details
Closed on
Feb 6, 1998
Sold by
Mendonca Estelle
Bought by
Costa James J
Create a Home Valuation Report for This Property
The Home Valuation Report is an in-depth analysis detailing your home's value as well as a comparison with similar homes in the area
Home Values in the Area
Average Home Value in this Area
Purchase History
| Date | Buyer | Sale Price | Title Company |
|---|---|---|---|
| Brum Gina | $225,000 | -- | |
| Reilly Thomas W | $83,000 | -- | |
| Costa James J | $8,000 | -- |
Source: Public Records
Mortgage History
| Date | Status | Borrower | Loan Amount |
|---|---|---|---|
| Open | Costa James J | $213,750 | |
| Closed | Costa James J | $180,000 | |
| Closed | Costa James J | $45,000 | |
| Previous Owner | Costa James J | $84,350 |
Source: Public Records
Tax History Compared to Growth
Tax History
| Year | Tax Paid | Tax Assessment Tax Assessment Total Assessment is a certain percentage of the fair market value that is determined by local assessors to be the total taxable value of land and additions on the property. | Land | Improvement |
|---|---|---|---|---|
| 2025 | $2,715 | $315,300 | $135,300 | $180,000 |
| 2024 | $2,654 | $305,400 | $135,300 | $170,100 |
| 2023 | $2,682 | $292,500 | $135,300 | $157,200 |
| 2022 | $2,631 | $265,800 | $135,300 | $130,500 |
| 2021 | $3,811 | $265,800 | $131,300 | $134,500 |
| 2020 | $3,660 | $258,600 | $130,000 | $128,600 |
| 2019 | $2,560 | $246,200 | $124,800 | $121,400 |
| 2018 | $3,553 | $242,500 | $127,400 | $115,100 |
| 2017 | $3,392 | $234,300 | $117,700 | $116,600 |
| 2016 | $2,116 | $208,300 | $104,100 | $104,200 |
| 2015 | $2,056 | $202,800 | $97,300 | $105,500 |
| 2014 | $2,020 | $197,800 | $94,600 | $103,200 |
Source: Public Records
Map
Nearby Homes