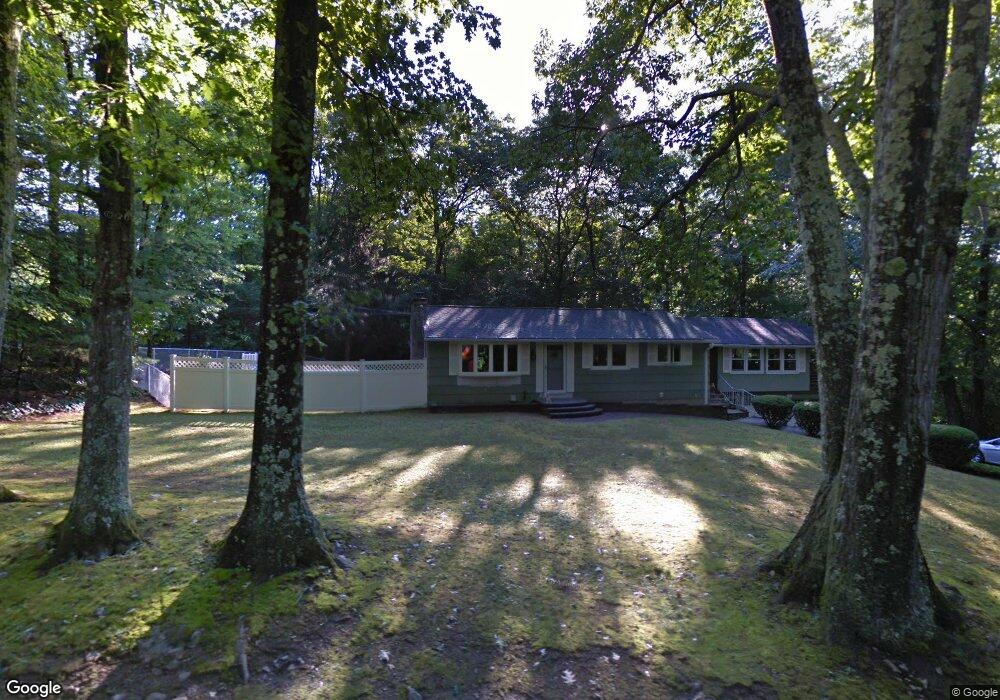
82 Clearview Ave Harwinton, CT 06791
Estimated Value: $423,000 - $530,000
3
Beds
2
Baths
1,548
Sq Ft
$297/Sq Ft
Est. Value
About This Home
This home is located at 82 Clearview Ave, Harwinton, CT 06791 and is currently estimated at $460,291, approximately $297 per square foot. 82 Clearview Ave is a home located in Litchfield County with nearby schools including Harwinton Consolidated School, Har-Bur Middle School, and Lewis S. Mills High School.
Ownership History
Date
Name
Owned For
Owner Type
Purchase Details
Closed on
Sep 13, 2023
Sold by
Royston Moira and Joesten Michael
Bought by
Michael Joesten and Michael Moira R
Current Estimated Value
Purchase Details
Closed on
Oct 22, 2002
Sold by
Hultman Paul E and Parsons Sandra T
Bought by
Mitchell Thomas N and Mitchell Deborah J
Home Financials for this Owner
Home Financials are based on the most recent Mortgage that was taken out on this home.
Original Mortgage
$160,000
Interest Rate
6.18%
Mortgage Type
Purchase Money Mortgage
Purchase Details
Closed on
Aug 5, 1994
Sold by
Donohue Frances P
Bought by
Hultman Paul E and Parsons Sondra T
Home Financials for this Owner
Home Financials are based on the most recent Mortgage that was taken out on this home.
Original Mortgage
$112,500
Interest Rate
8.88%
Mortgage Type
Purchase Money Mortgage
Create a Home Valuation Report for This Property
The Home Valuation Report is an in-depth analysis detailing your home's value as well as a comparison with similar homes in the area
Home Values in the Area
Average Home Value in this Area
Purchase History
| Date | Buyer | Sale Price | Title Company |
|---|---|---|---|
| Michael Joesten | -- | None Available | |
| Michael Joesten | -- | None Available | |
| Mitchell Thomas N | $240,000 | -- | |
| Mitchell Thomas N | $240,000 | -- | |
| Hultman Paul E | $127,500 | -- | |
| Hultman Paul E | $127,500 | -- |
Source: Public Records
Mortgage History
| Date | Status | Borrower | Loan Amount |
|---|---|---|---|
| Previous Owner | Hultman Paul E | $100,000 | |
| Previous Owner | Hultman Paul E | $160,000 | |
| Previous Owner | Hultman Paul E | $112,500 |
Source: Public Records
Tax History Compared to Growth
Tax History
| Year | Tax Paid | Tax Assessment Tax Assessment Total Assessment is a certain percentage of the fair market value that is determined by local assessors to be the total taxable value of land and additions on the property. | Land | Improvement |
|---|---|---|---|---|
| 2025 | $5,549 | $241,240 | $72,890 | $168,350 |
| 2024 | $5,524 | $241,240 | $72,890 | $168,350 |
| 2023 | $4,662 | $159,650 | $45,610 | $114,040 |
| 2022 | $4,550 | $159,650 | $45,610 | $114,040 |
| 2021 | $4,582 | $159,650 | $45,610 | $114,040 |
| 2020 | $4,470 | $159,650 | $45,610 | $114,040 |
| 2019 | $4,470 | $159,650 | $45,610 | $114,040 |
| 2018 | $4,672 | $166,850 | $58,000 | $108,850 |
| 2017 | $4,638 | $166,850 | $58,000 | $108,850 |
| 2016 | $4,638 | $166,850 | $58,000 | $108,850 |
| 2015 | $4,555 | $166,850 | $58,000 | $108,850 |
| 2014 | $4,488 | $166,850 | $58,000 | $108,850 |
Source: Public Records
Map
Nearby Homes
- 39 Orchard Hill Rd
- 0 Hill Rd Unit 24132154
- 448 Litchfield Rd
- 29 Branch Rd
- 544 Litchfield Rd
- 74 Pine Ridge Dr
- Lot 2 Birch Hill Rd
- 18 Highview Dr
- 183 Wildcat Hill Rd
- 164 Birge Park Rd
- 172 Pierce St
- 2 Perkins St Unit 14
- 123 Woodland Dr
- 50 King St
- 699 S Main St Unit 323
- 505 Harwinton Ave Unit 21
- 528 Clearview Ave
- 21 South Rd
- 615 S Main St
- 29 Hannah Way
- 90 Clearview Ave
- 100 Clearview Ave
- 77 Clearview Ave
- 74 Clearview Ave
- 60 Clearview Ave
- 89 Clearview Ave
- 111 Clearview Ave
- 61 Clearview Ave
- 44 Clearview Ave
- 0 Orchard Hill Rd Unit 170078859
- 0 Orchard Hill Rd Unit L10044911
- 0 Orchard Hill Rd Unit A10131321
- 0 Orchard Hill Rd Unit A10207096
- 0 Orchard Hill Rd
- 32 Clearview Ave
- 122 Clearview Ave
- 8 Orchard Hill Rd
- 9 Orchard Hill Rd
- 14 Orchard Hill Rd
- 9 Orchard Hill Rd