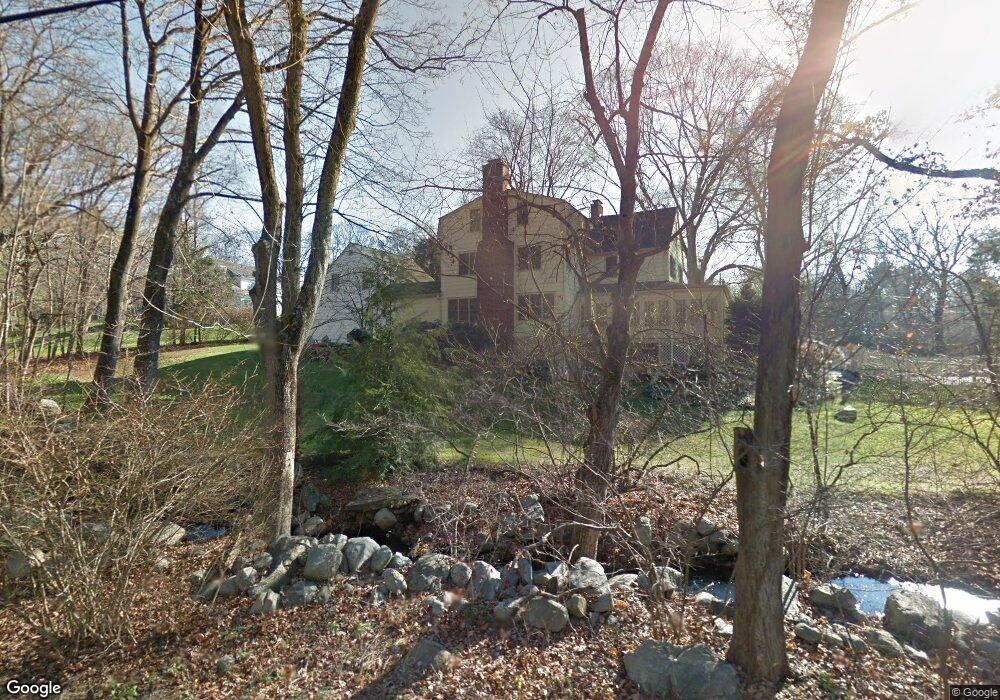
82 Compo Rd N Westport, CT 06880
Staples NeighborhoodEstimated Value: $2,539,362 - $3,038,000
5
Beds
5
Baths
4,752
Sq Ft
$592/Sq Ft
Est. Value
About This Home
This home is located at 82 Compo Rd N, Westport, CT 06880 and is currently estimated at $2,813,591, approximately $592 per square foot. 82 Compo Rd N is a home located in Fairfield County with nearby schools including Saugatuck Elementary School, Bedford Middle School, and Staples High School.
Ownership History
Date
Name
Owned For
Owner Type
Purchase Details
Closed on
Mar 30, 2004
Sold by
Paolini Adrian T
Bought by
Goldberg Gary and Goldberg Amy
Current Estimated Value
Purchase Details
Closed on
Mar 16, 1992
Sold by
Grogan David and Grogan Ann
Bought by
Goldberg Gary and Goldberg Mary
Create a Home Valuation Report for This Property
The Home Valuation Report is an in-depth analysis detailing your home's value as well as a comparison with similar homes in the area
Home Values in the Area
Average Home Value in this Area
Purchase History
| Date | Buyer | Sale Price | Title Company |
|---|---|---|---|
| Goldberg Gary | $1,399,000 | -- | |
| Goldberg Gary | $1,399,000 | -- | |
| Goldberg Gary | $1,262,500 | -- |
Source: Public Records
Mortgage History
| Date | Status | Borrower | Loan Amount |
|---|---|---|---|
| Open | Goldberg Gary | $500,000 | |
| Closed | Goldberg Gary | $708,000 | |
| Closed | Goldberg Gary | $708,750 |
Source: Public Records
Tax History Compared to Growth
Tax History
| Year | Tax Paid | Tax Assessment Tax Assessment Total Assessment is a certain percentage of the fair market value that is determined by local assessors to be the total taxable value of land and additions on the property. | Land | Improvement |
|---|---|---|---|---|
| 2025 | $20,001 | $1,060,500 | $413,500 | $647,000 |
| 2024 | $19,747 | $1,060,500 | $413,500 | $647,000 |
| 2023 | $19,460 | $1,060,500 | $413,500 | $647,000 |
| 2022 | $19,163 | $1,060,500 | $413,500 | $647,000 |
| 2021 | $19,163 | $1,060,500 | $413,500 | $647,000 |
| 2020 | $18,165 | $1,152,300 | $455,100 | $697,200 |
| 2019 | $19,428 | $1,152,300 | $455,100 | $697,200 |
| 2018 | $0 | $1,152,300 | $455,100 | $697,200 |
| 2017 | $0 | $1,152,300 | $455,100 | $697,200 |
| 2016 | $19,428 | $1,152,300 | $455,100 | $697,200 |
| 2015 | $18,195 | $1,005,800 | $386,900 | $618,900 |
| 2014 | $18,044 | $1,005,800 | $386,900 | $618,900 |
Source: Public Records
Map
Nearby Homes