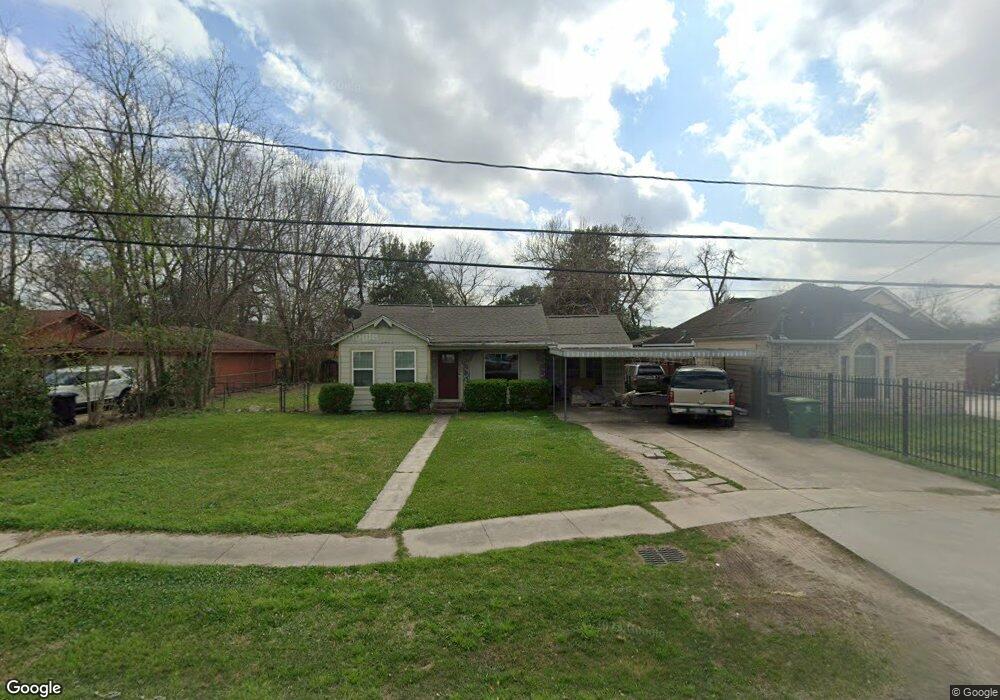
82 De Boll St Houston, TX 77022
Northside-Northline NeighborhoodEstimated Value: $237,000 - $295,000
3
Beds
2
Baths
1,640
Sq Ft
$166/Sq Ft
Est. Value
About This Home
This home is located at 82 De Boll St, Houston, TX 77022 and is currently estimated at $272,467, approximately $166 per square foot. 82 De Boll St is a home located in Harris County with nearby schools including Burbank Elementary School, Burbank Middle School, and Sam Houston Math, Science & Technology Center.
Ownership History
Date
Name
Owned For
Owner Type
Purchase Details
Closed on
Nov 17, 2009
Sold by
Comeaux Mary F and Sepolio Mary Frances Fields
Bought by
Garza Hector A and Garza Nubia E
Current Estimated Value
Home Financials for this Owner
Home Financials are based on the most recent Mortgage that was taken out on this home.
Original Mortgage
$77,569
Outstanding Balance
$51,928
Interest Rate
5.5%
Mortgage Type
FHA
Estimated Equity
$220,539
Create a Home Valuation Report for This Property
The Home Valuation Report is an in-depth analysis detailing your home's value as well as a comparison with similar homes in the area
Home Values in the Area
Average Home Value in this Area
Purchase History
| Date | Buyer | Sale Price | Title Company |
|---|---|---|---|
| Garza Hector A | -- | Tx American |
Source: Public Records
Mortgage History
| Date | Status | Borrower | Loan Amount |
|---|---|---|---|
| Open | Garza Hector A | $77,569 |
Source: Public Records
Tax History Compared to Growth
Tax History
| Year | Tax Paid | Tax Assessment Tax Assessment Total Assessment is a certain percentage of the fair market value that is determined by local assessors to be the total taxable value of land and additions on the property. | Land | Improvement |
|---|---|---|---|---|
| 2025 | $1,307 | $278,652 | $74,104 | $204,548 |
| 2024 | $1,307 | $278,652 | $74,104 | $204,548 |
| 2023 | $1,307 | $247,141 | $74,104 | $173,037 |
| 2022 | $2,361 | $191,307 | $53,637 | $137,670 |
| 2021 | $2,272 | $118,942 | $53,637 | $65,305 |
| 2020 | $2,146 | $104,946 | $53,637 | $51,309 |
| 2019 | $2,039 | $84,782 | $34,458 | $50,324 |
| 2018 | $1,188 | $73,248 | $37,052 | $36,196 |
| 2017 | $1,852 | $73,248 | $37,052 | $36,196 |
| 2016 | $1,852 | $73,248 | $37,052 | $36,196 |
| 2015 | $1,305 | $71,812 | $37,052 | $34,760 |
| 2014 | $1,305 | $71,812 | $37,052 | $34,760 |
Source: Public Records
Map
Nearby Homes
- 70 Burress St
- 90 Burress St Unit B
- 90 Burress St Unit A
- 61 Trenwood Ln
- 108 Fichter St
- 44 Farrell St
- 9625 Fulton St
- 45 Wellford St
- 216 Burress St
- 56 Wellford St
- 249 De Boll St
- 253 De Boll St
- 91 Burbank St
- 132 Grothe Ln
- 202 Burbank St
- 110 Luetta St
- 108 Luetta St
- 106 Luetta St
- 104 Luetta St
- 0 Burbank St Unit 9886770