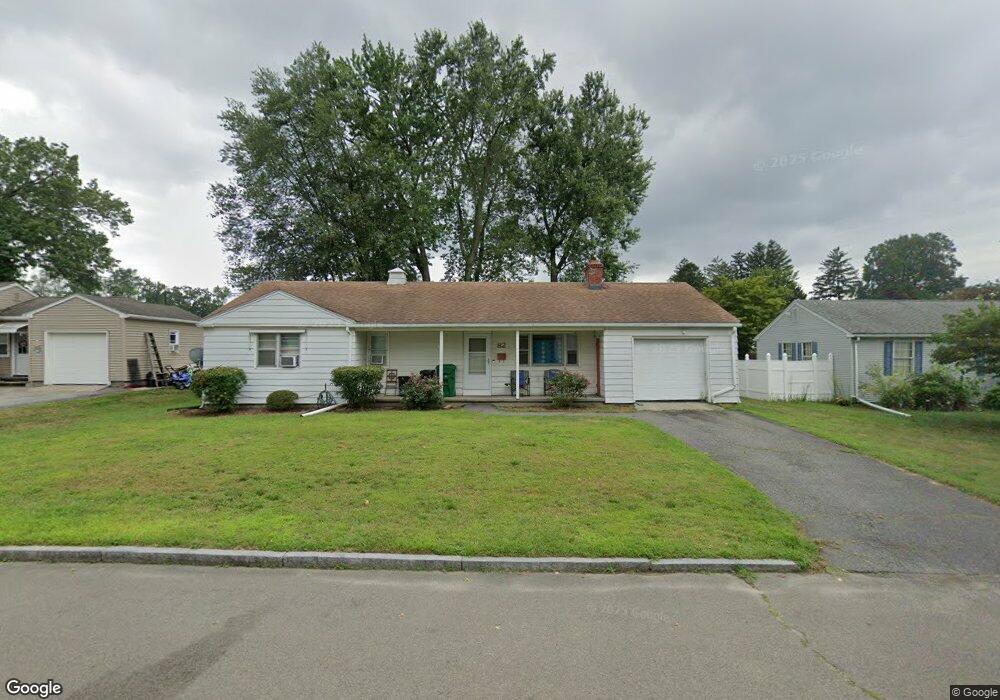
82 Donlyn Dr Chicopee, MA 01013
Chicopee Center NeighborhoodEstimated Value: $282,000 - $321,000
3
Beds
2
Baths
1,112
Sq Ft
$272/Sq Ft
Est. Value
About This Home
This home is located at 82 Donlyn Dr, Chicopee, MA 01013 and is currently estimated at $302,807, approximately $272 per square foot. 82 Donlyn Dr is a home located in Hampden County with nearby schools including Bowe Elementary School, Fairview Middle School, and Chicopee High School.
Ownership History
Date
Name
Owned For
Owner Type
Purchase Details
Closed on
Oct 16, 1995
Sold by
Curylo James W
Bought by
Drazga Edmund A
Current Estimated Value
Home Financials for this Owner
Home Financials are based on the most recent Mortgage that was taken out on this home.
Original Mortgage
$23,000
Outstanding Balance
$163
Interest Rate
7.71%
Mortgage Type
Purchase Money Mortgage
Estimated Equity
$302,644
Create a Home Valuation Report for This Property
The Home Valuation Report is an in-depth analysis detailing your home's value as well as a comparison with similar homes in the area
Home Values in the Area
Average Home Value in this Area
Purchase History
| Date | Buyer | Sale Price | Title Company |
|---|---|---|---|
| Drazga Edmund A | $83,000 | -- |
Source: Public Records
Mortgage History
| Date | Status | Borrower | Loan Amount |
|---|---|---|---|
| Open | Drazga Edmund A | $23,000 |
Source: Public Records
Tax History
| Year | Tax Paid | Tax Assessment Tax Assessment Total Assessment is a certain percentage of the fair market value that is determined by local assessors to be the total taxable value of land and additions on the property. | Land | Improvement |
|---|---|---|---|---|
| 2025 | $3,738 | $246,600 | $92,900 | $153,700 |
| 2024 | $3,616 | $245,000 | $91,100 | $153,900 |
| 2023 | $3,350 | $221,100 | $82,800 | $138,300 |
| 2022 | $3,186 | $187,500 | $72,000 | $115,500 |
| 2021 | $3,076 | $174,700 | $65,500 | $109,200 |
| 2020 | $2,888 | $165,400 | $65,500 | $99,900 |
| 2019 | $2,839 | $158,100 | $65,500 | $92,600 |
| 2018 | $2,770 | $151,300 | $62,300 | $89,000 |
| 2017 | $2,642 | $152,600 | $62,300 | $90,300 |
| 2016 | $2,596 | $153,500 | $62,300 | $91,200 |
| 2015 | $2,775 | $158,200 | $62,300 | $95,900 |
| 2014 | $1,387 | $158,200 | $62,300 | $95,900 |
Source: Public Records
Map
Nearby Homes
Your Personal Tour Guide
Ask me questions while you tour the home.