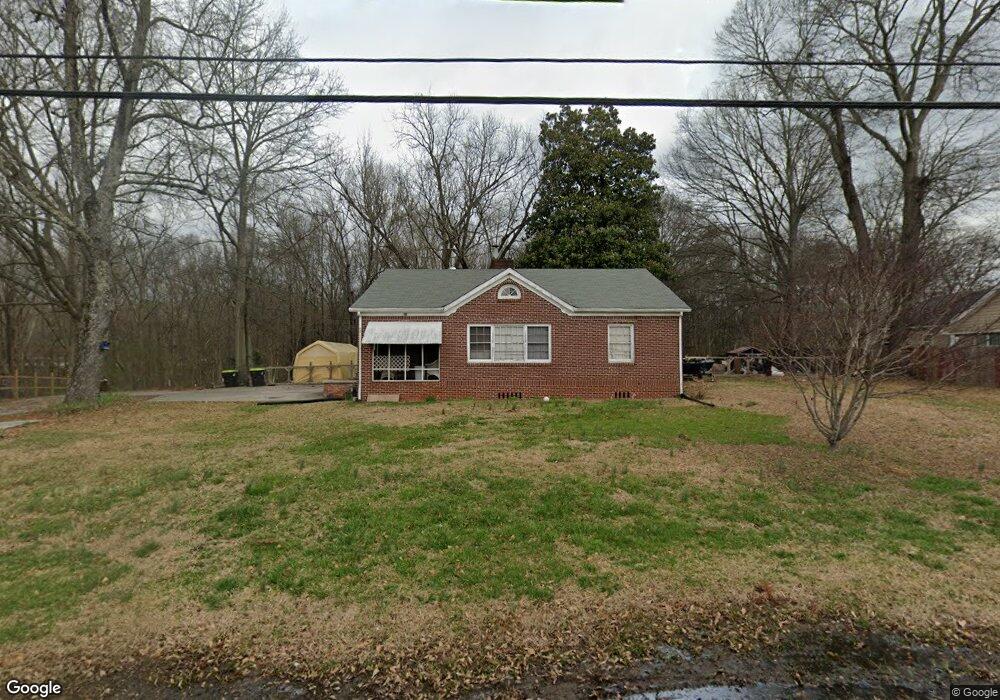
82 E Johnson St Temple, GA 30179
Estimated Value: $197,000 - $353,211
3
Beds
1
Bath
1,397
Sq Ft
$178/Sq Ft
Est. Value
About This Home
This home is located at 82 E Johnson St, Temple, GA 30179 and is currently estimated at $248,053, approximately $177 per square foot. 82 E Johnson St is a home located in Carroll County with nearby schools including Providence Elementary School, Temple Middle School, and Temple High School.
Ownership History
Date
Name
Owned For
Owner Type
Purchase Details
Closed on
Aug 22, 2011
Sold by
Premier Realty Svcs
Bought by
Tomblin Emory W
Current Estimated Value
Purchase Details
Closed on
Sep 10, 2003
Sold by
Hollis George L
Bought by
Hollis George L
Purchase Details
Closed on
Aug 15, 2003
Sold by
City Of Temple
Bought by
Phillips Darlene H
Purchase Details
Closed on
Feb 27, 2003
Sold by
Phillips Darlene H
Bought by
Hollis George L
Purchase Details
Closed on
Sep 18, 2002
Sold by
Rutledge Mary
Bought by
Phillips Darlene H
Purchase Details
Closed on
Mar 21, 2002
Sold by
Hollis George L
Bought by
Hollis George L
Purchase Details
Closed on
Oct 4, 1995
Bought by
Rutledge Joseph and Rutledge Ma
Purchase Details
Closed on
Mar 13, 1989
Sold by
Rutledge Joseph and Rutledge Ma
Bought by
Ruthledge Mary
Purchase Details
Closed on
Oct 11, 1987
Bought by
Rutledge Joseph and Rutledge M
Create a Home Valuation Report for This Property
The Home Valuation Report is an in-depth analysis detailing your home's value as well as a comparison with similar homes in the area
Home Values in the Area
Average Home Value in this Area
Purchase History
| Date | Buyer | Sale Price | Title Company |
|---|---|---|---|
| Tomblin Emory W | -- | -- | |
| Premier Realty Svcs | -- | -- | |
| Hollis George L | -- | -- | |
| Hollis George L | -- | -- | |
| Phillips Darlene H | -- | -- | |
| Hollis George L | $80,000 | -- | |
| Phillips Darlene H | -- | -- | |
| Hollis George L | -- | -- | |
| Hollis George L | -- | -- | |
| Rutledge Joseph | -- | -- | |
| Ruthledge Mary | -- | -- | |
| Rutledge Joseph | -- | -- |
Source: Public Records
Tax History
| Year | Tax Paid | Tax Assessment Tax Assessment Total Assessment is a certain percentage of the fair market value that is determined by local assessors to be the total taxable value of land and additions on the property. | Land | Improvement |
|---|---|---|---|---|
| 2025 | $349 | $47,158 | $6,000 | $41,158 |
| 2024 | $350 | $47,158 | $6,000 | $41,158 |
| 2023 | $350 | $43,530 | $6,000 | $37,530 |
| 2022 | $372 | $36,391 | $6,000 | $30,391 |
| 2021 | $360 | $32,212 | $6,000 | $26,212 |
| 2020 | $925 | $29,624 | $6,000 | $23,624 |
| 2019 | $876 | $27,830 | $6,000 | $21,830 |
| 2018 | $304 | $25,735 | $6,000 | $19,735 |
| 2017 | $313 | $25,735 | $6,000 | $19,735 |
| 2016 | $315 | $25,735 | $6,000 | $19,735 |
| 2015 | $408 | $30,868 | $7,647 | $23,221 |
| 2014 | $411 | $30,868 | $7,647 | $23,221 |
Source: Public Records
Map
Nearby Homes
- 44 E Johnson St
- 0 Highway 113 Unit 10586141
- 51 Carrollton St
- 95 Carrollton St
- 119 E Johnson St
- 96 Rome St
- 110 Driver St
- 92 James St
- 140 Creek Crossing Ln
- 25 Old Bremen Rd
- 292 E Johnson St
- 130 Carroll St
- 116 Deer Crossing Unit LOT 4
- 221 Rome St
- 587 E Johnson St
- 121 E Woodland Manor
- 407 Nottely Dr
- 408 Nottely Dr
- 238 James Allen Place
- 502 Lanier Way
- 90 E Johnson St
- 66 E Johnson St
- 102 E Johnson St
- 52 E Johnson St
- 112 E Johnson St
- 399 Sage St
- 124 E Johnson St
- 0 Highway 113 Unit 3255453
- 0 Highway 113 Unit 3261664
- 0 Highway 113 Unit 10318954
- 0 Highway 113 Unit 8962138
- 0 Highway 113 Unit 8951993
- 0 Highway 113 Unit 8738424
- 0 Highway 113 Unit 8510434
- 50 Riggs St
- 26 Carrollton St
- 25 Riggs St
- 62 Carrollton St
- 134 E Johnson St
- 35 Riggs St
Your Personal Tour Guide
Ask me questions while you tour the home.