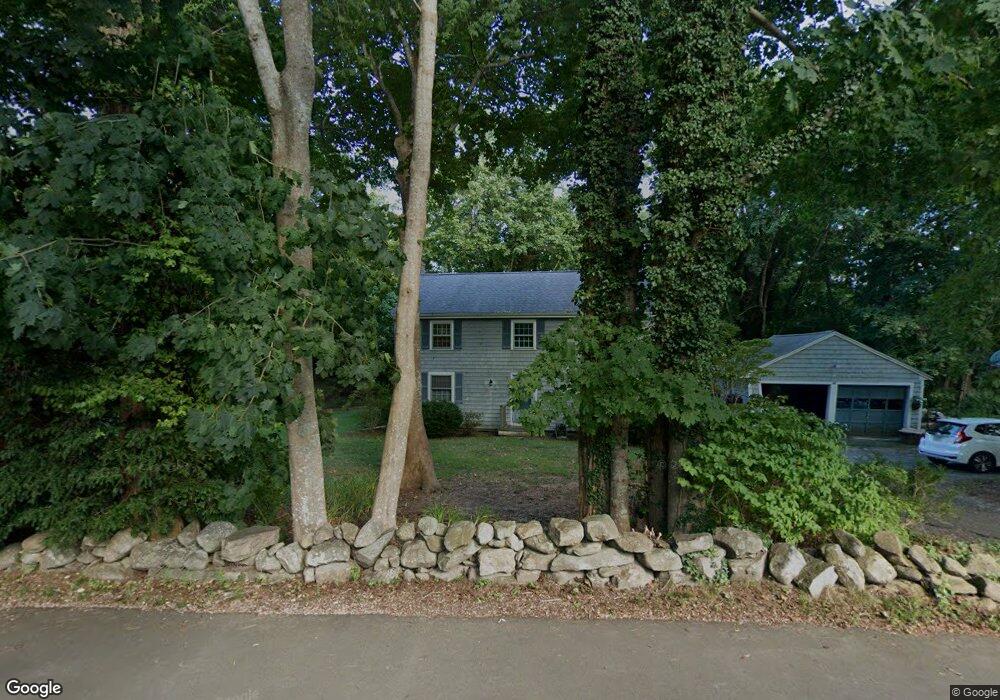
82 Elm Rd Falmouth, MA 02540
Falmouth Village NeighborhoodEstimated Value: $849,000 - $1,628,000
4
Beds
2
Baths
1,824
Sq Ft
$642/Sq Ft
Est. Value
About This Home
This home is located at 82 Elm Rd, Falmouth, MA 02540 and is currently estimated at $1,171,825, approximately $642 per square foot. 82 Elm Rd is a home located in Barnstable County with nearby schools including Mullen-Hall School, Lawrence School, and Morse Pond School.
Ownership History
Date
Name
Owned For
Owner Type
Purchase Details
Closed on
Jun 2, 2008
Sold by
Haycock Mark J
Bought by
Haycock Joyce P and Haycock Mark J
Current Estimated Value
Home Financials for this Owner
Home Financials are based on the most recent Mortgage that was taken out on this home.
Original Mortgage
$255,000
Outstanding Balance
$161,743
Interest Rate
5.91%
Mortgage Type
Purchase Money Mortgage
Estimated Equity
$1,010,082
Purchase Details
Closed on
Jan 30, 1991
Sold by
First Natl Bk Boston
Bought by
Haycock Mark J and Haycock Kathryn L
Create a Home Valuation Report for This Property
The Home Valuation Report is an in-depth analysis detailing your home's value as well as a comparison with similar homes in the area
Home Values in the Area
Average Home Value in this Area
Purchase History
| Date | Buyer | Sale Price | Title Company |
|---|---|---|---|
| Haycock Joyce P | -- | -- | |
| Haycock Joyce P | -- | -- | |
| Haycock Joyce P | -- | -- | |
| Haycock Mark J | $145,000 | -- | |
| Haycock Mark J | $145,000 | -- |
Source: Public Records
Mortgage History
| Date | Status | Borrower | Loan Amount |
|---|---|---|---|
| Open | Haycock Joyce P | $255,000 | |
| Closed | Haycock Mark J | $255,000 | |
| Previous Owner | Haycock Mark J | $15,000 |
Source: Public Records
Tax History Compared to Growth
Tax History
| Year | Tax Paid | Tax Assessment Tax Assessment Total Assessment is a certain percentage of the fair market value that is determined by local assessors to be the total taxable value of land and additions on the property. | Land | Improvement |
|---|---|---|---|---|
| 2025 | $5,326 | $907,400 | $537,500 | $369,900 |
| 2024 | $5,046 | $803,500 | $466,700 | $336,800 |
| 2023 | $4,367 | $631,100 | $388,900 | $242,200 |
| 2022 | $4,352 | $540,600 | $331,600 | $209,000 |
| 2021 | $4,347 | $511,400 | $331,600 | $179,800 |
| 2020 | $4,134 | $481,200 | $301,400 | $179,800 |
| 2019 | $4,106 | $479,700 | $301,400 | $178,300 |
| 2018 | $4,077 | $474,100 | $301,400 | $172,700 |
| 2017 | $3,994 | $468,200 | $301,400 | $166,800 |
| 2016 | $3,919 | $468,200 | $301,400 | $166,800 |
| 2015 | $3,835 | $468,200 | $301,400 | $166,800 |
| 2014 | $3,813 | $467,800 | $301,500 | $166,300 |
Source: Public Records
Map
Nearby Homes
- 71 Main St
- 15 Hedge Ln
- 98 Main St
- 98 Main St Unit 1
- 65 Walker St
- 38 Landfall Unit 38
- 38 Landfall
- 30 Katherine Lee Bates Rd
- 33 Oakwood Ave
- 480 Main St Unit 1
- 87 Oyster Pond Rd
- 110 Dillingham Ave Unit 322
- 251 Woods Hole Rd
- 45 Haynes Ave
- 27 Upland Ave
- 253 Scranton Ave
- 354 Gifford St Unit 5
- 354 Gifford St Unit 2
- 354 Gifford St Unit 6