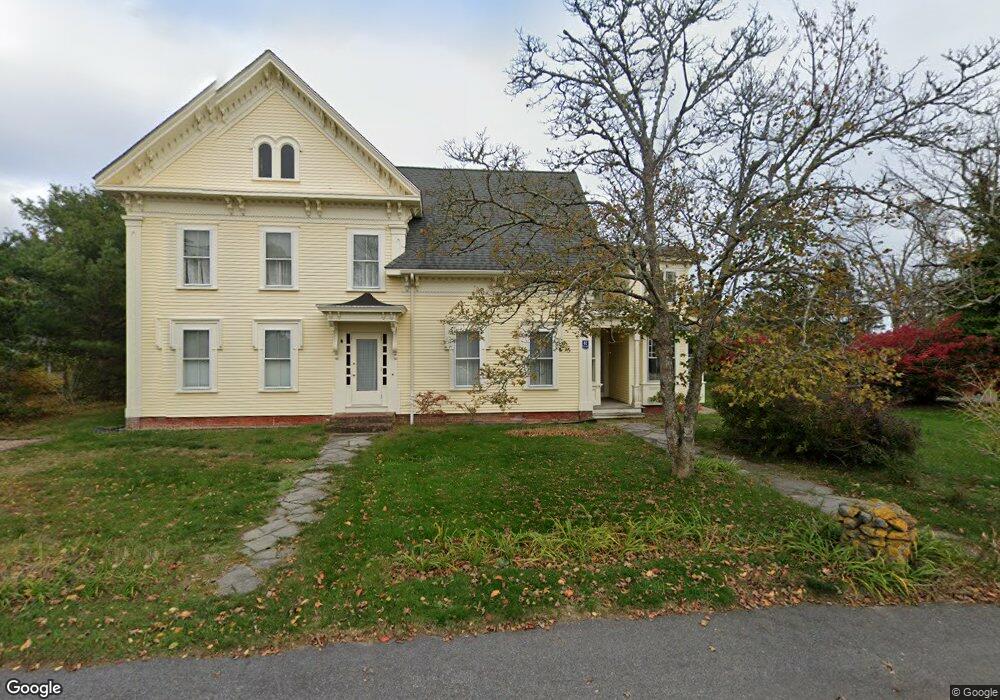
82 Fisk St West Dennis, MA 02670
West Dennis NeighborhoodEstimated Value: $827,870 - $1,010,000
7
Beds
3
Baths
3,356
Sq Ft
$270/Sq Ft
Est. Value
About This Home
This home is located at 82 Fisk St, West Dennis, MA 02670 and is currently estimated at $906,718, approximately $270 per square foot. 82 Fisk St is a home located in Barnstable County with nearby schools including Dennis-Yarmouth Regional High School and St. Pius X. School.
Ownership History
Date
Name
Owned For
Owner Type
Purchase Details
Closed on
Sep 8, 2025
Sold by
Siegfried Edward
Bought by
Edward Siegfried Ret and Siegfried
Current Estimated Value
Purchase Details
Closed on
Dec 17, 2007
Sold by
Siegfried Edward and Siegfried Margaret
Bought by
Edward Siegfried Ret and Siegfried
Purchase Details
Closed on
Nov 27, 1992
Sold by
Mccarthy James D
Bought by
Siegfried Margaret and Siegfried Edward
Create a Home Valuation Report for This Property
The Home Valuation Report is an in-depth analysis detailing your home's value as well as a comparison with similar homes in the area
Home Values in the Area
Average Home Value in this Area
Purchase History
| Date | Buyer | Sale Price | Title Company |
|---|---|---|---|
| Edward Siegfried Ret | -- | -- | |
| Siegfried Edward | -- | -- | |
| Edward Siegfried Ret | -- | -- | |
| Edward Siegfried Ret | -- | -- | |
| Siegfried Margaret | $135,000 | -- |
Source: Public Records
Mortgage History
| Date | Status | Borrower | Loan Amount |
|---|---|---|---|
| Previous Owner | Siegfried Margaret | $200,000 | |
| Previous Owner | Siegfried Margaret | $45,400 | |
| Previous Owner | Siegfried Margaret | $69,800 |
Source: Public Records
Tax History Compared to Growth
Tax History
| Year | Tax Paid | Tax Assessment Tax Assessment Total Assessment is a certain percentage of the fair market value that is determined by local assessors to be the total taxable value of land and additions on the property. | Land | Improvement |
|---|---|---|---|---|
| 2025 | $3,054 | $705,200 | $177,900 | $527,300 |
| 2024 | $2,968 | $676,000 | $171,100 | $504,900 |
| 2023 | $2,871 | $614,800 | $155,500 | $459,300 |
| 2022 | $2,775 | $495,500 | $154,100 | $341,400 |
| 2021 | $0 | $484,600 | $151,100 | $333,500 |
| 2020 | $3,424 | $494,800 | $164,800 | $330,000 |
| 2019 | $0 | $472,400 | $134,700 | $337,700 |
| 2018 | $3,130 | $487,700 | $192,300 | $295,400 |
| 2017 | $0 | $459,600 | $153,900 | $305,700 |
| 2016 | $2,803 | $429,300 | $173,100 | $256,200 |
| 2015 | $2,748 | $429,300 | $173,100 | $256,200 |
| 2014 | $2,781 | $437,900 | $173,100 | $264,800 |
Source: Public Records
Map
Nearby Homes
- 14 Schoolhouse Ln
- 209 Main St Unit 3
- 209 Main St Unit 6
- 209 Main St Unit 1
- 209 Main St Unit 2
- 209 Main St Unit 4
- 209 Main St Unit 5
- 23 Doric Ave
- 178 School St
- 401 Main St Unit 201
- 401 Main St Unit 101
- 2 Rita Mary Way
- 467 Main St
- 45 Seth Ln
- 40 Kelley Rd
- 308 Old Main St
- 61 Trotters Ln
- 29 Bass River Rd
- 18 Turner Ln
- 116 N Main St