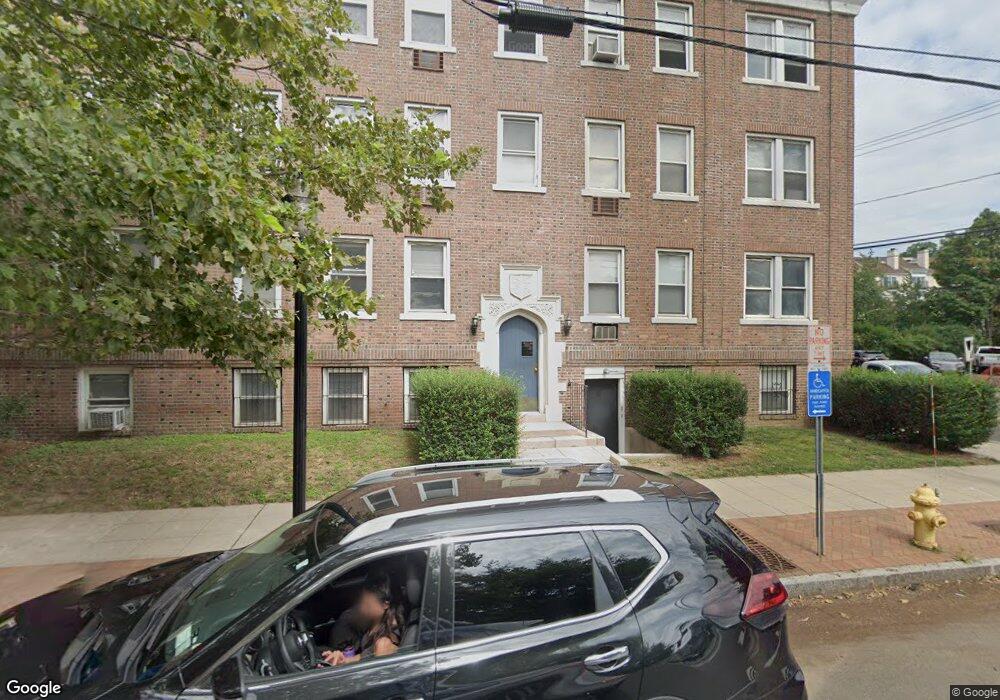
82 Forest St Unit D2 Stamford, CT 06901
Downtown Stamford NeighborhoodEstimated Value: $314,012 - $343,000
2
Beds
1
Bath
976
Sq Ft
$340/Sq Ft
Est. Value
About This Home
This home is located at 82 Forest St Unit D2, Stamford, CT 06901 and is currently estimated at $332,253, approximately $340 per square foot. 82 Forest St Unit D2 is a home located in Fairfield County with nearby schools including Stillmeadow Elementary School, Rippowam Middle School, and Stamford High School.
Ownership History
Date
Name
Owned For
Owner Type
Purchase Details
Closed on
Nov 9, 2020
Sold by
Delany Frank J
Bought by
Taylor Nicole M
Current Estimated Value
Purchase Details
Closed on
Apr 3, 2006
Sold by
Tika Pandeli
Bought by
Karolus Christian and Farreh Colleen
Home Financials for this Owner
Home Financials are based on the most recent Mortgage that was taken out on this home.
Original Mortgage
$245,700
Interest Rate
6.32%
Purchase Details
Closed on
Nov 27, 2002
Sold by
Perkins Mark L and Perkins Deborah L
Bought by
Tika Pandeli
Home Financials for this Owner
Home Financials are based on the most recent Mortgage that was taken out on this home.
Original Mortgage
$133,900
Interest Rate
6.16%
Purchase Details
Closed on
May 8, 2001
Sold by
Kaplan Joshua D and Katnick Dale
Bought by
Perkins Mark L and Anderson Deborah L
Home Financials for this Owner
Home Financials are based on the most recent Mortgage that was taken out on this home.
Original Mortgage
$105,600
Interest Rate
6.85%
Create a Home Valuation Report for This Property
The Home Valuation Report is an in-depth analysis detailing your home's value as well as a comparison with similar homes in the area
Home Values in the Area
Average Home Value in this Area
Purchase History
| Date | Buyer | Sale Price | Title Company |
|---|---|---|---|
| Taylor Nicole M | $225,000 | None Available | |
| Karolus Christian | $273,000 | -- | |
| Tika Pandeli | $192,500 | -- | |
| Perkins Mark L | $132,000 | -- |
Source: Public Records
Mortgage History
| Date | Status | Borrower | Loan Amount |
|---|---|---|---|
| Previous Owner | Perkins Mark L | $245,700 | |
| Previous Owner | Perkins Mark L | $133,900 | |
| Previous Owner | Perkins Mark L | $105,600 | |
| Closed | Perkins Mark L | $13,464 |
Source: Public Records
Tax History
| Year | Tax Paid | Tax Assessment Tax Assessment Total Assessment is a certain percentage of the fair market value that is determined by local assessors to be the total taxable value of land and additions on the property. | Land | Improvement |
|---|---|---|---|---|
| 2025 | $3,660 | $153,020 | $0 | $153,020 |
| 2024 | $3,575 | $153,020 | $0 | $153,020 |
| 2023 | $3,862 | $153,020 | $0 | $153,020 |
| 2022 | $3,703 | $136,290 | $0 | $136,290 |
| 2021 | $3,672 | $136,290 | $0 | $136,290 |
| 2020 | $3,591 | $136,290 | $0 | $136,290 |
| 2019 | $3,591 | $136,290 | $0 | $136,290 |
| 2018 | $3,479 | $136,290 | $0 | $136,290 |
| 2017 | $3,215 | $119,550 | $0 | $119,550 |
| 2016 | $3,123 | $119,550 | $0 | $119,550 |
| 2015 | $3,040 | $119,550 | $0 | $119,550 |
| 2014 | $2,964 | $119,550 | $0 | $119,550 |
Source: Public Records
Map
Nearby Homes
- 101 Grove St Unit 19
- 111 Grove St
- 91 Highland Rd
- 99 Prospect St Unit 3M
- 44 Pleasant St Unit 12
- 25 Forest St Unit 11M
- 25 Forest St Unit 7D
- 25 Forest St Unit 15E
- 25 Forest St Unit 4A
- 71 Lindale St
- 300 Broad St Unit 707
- 22 Glenbrook Rd Unit 414
- 30 Glenbrook Rd Unit 10F
- 143 Hoyt St Unit 2H
- 143 Hoyt St Unit 3K
- 143 Hoyt St Unit 5K
- 1 Strawberry Hill Ave Unit 10A
- 50 Glenbrook Rd Unit 4E
- 50 Glenbrook Rd Unit 5G
- 50 Glenbrook Rd Unit 9C
- 82 Forest St Unit D3
- 82 Forest St Unit D1
- 82 Forest St Unit C6
- 82 Forest St Unit C5
- 82 Forest St Unit C4
- 82 Forest St Unit C3
- 82 Forest St Unit C2
- 82 Forest St Unit C1
- 82 Forest St Unit B6
- 82 Forest St Unit B5
- 82 Forest St Unit B4
- 82 Forest St Unit B3
- 82 Forest St Unit B2
- 82 Forest St Unit B1
- 82 Forest St Unit A8
- 82 Forest St Unit A7
- 82 Forest St Unit A6
- 82 Forest St Unit A5
- 82 Forest St Unit A4
- 82 Forest St Unit A3
Your Personal Tour Guide
Ask me questions while you tour the home.