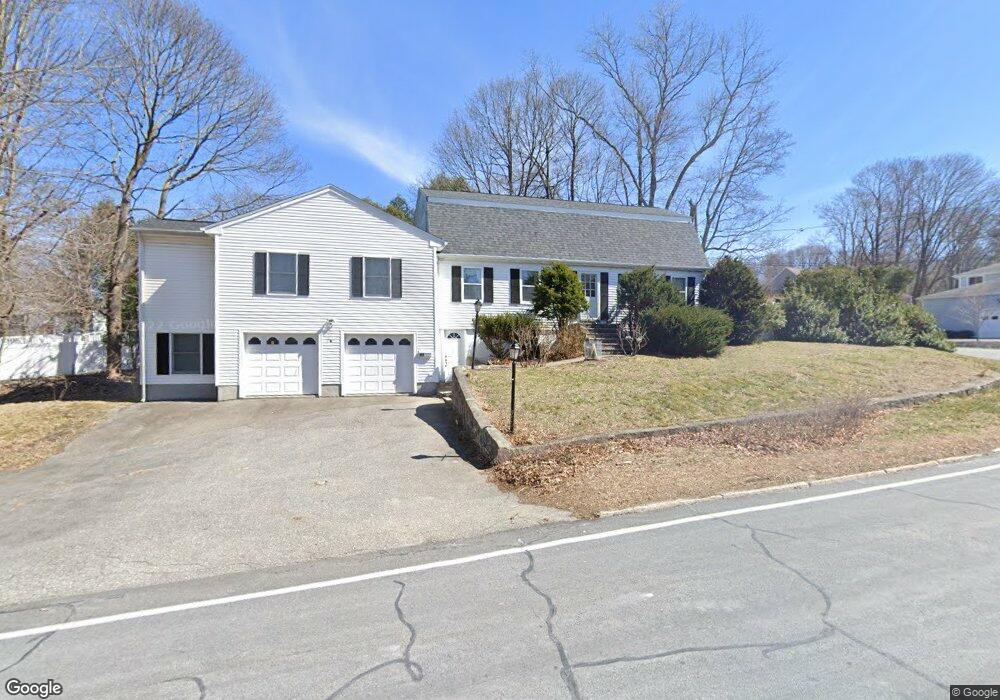
82 Grove St Winchester, MA 01890
Grove Street NeighborhoodEstimated Value: $1,677,000 - $1,748,000
4
Beds
5
Baths
3,162
Sq Ft
$540/Sq Ft
Est. Value
About This Home
This home is located at 82 Grove St, Winchester, MA 01890 and is currently estimated at $1,707,620, approximately $540 per square foot. 82 Grove St is a home located in Middlesex County with nearby schools including Ambrose Elementary School, McCall Middle School, and Winchester High School.
Ownership History
Date
Name
Owned For
Owner Type
Purchase Details
Closed on
Jul 3, 2019
Sold by
Karafillis Apostolos P and Dova Stamatia G
Bought by
Apostolos P Karafillis T
Current Estimated Value
Purchase Details
Closed on
May 16, 2008
Sold by
Guarnaccia Antoinette D and Guarnaccia Guy
Bought by
Karafillis Apostolos P and Dova Stamatia G
Home Financials for this Owner
Home Financials are based on the most recent Mortgage that was taken out on this home.
Original Mortgage
$417,000
Interest Rate
5.91%
Mortgage Type
Purchase Money Mortgage
Purchase Details
Closed on
Mar 15, 1996
Sold by
Russo Robert D and Russo Nancy C
Bought by
Cho Chang Koo and Cho Myong Sook
Create a Home Valuation Report for This Property
The Home Valuation Report is an in-depth analysis detailing your home's value as well as a comparison with similar homes in the area
Home Values in the Area
Average Home Value in this Area
Purchase History
| Date | Buyer | Sale Price | Title Company |
|---|---|---|---|
| Apostolos P Karafillis T | -- | -- | |
| Karafillis Apostolos P | $690,000 | -- | |
| Cho Chang Koo | $269,000 | -- |
Source: Public Records
Mortgage History
| Date | Status | Borrower | Loan Amount |
|---|---|---|---|
| Previous Owner | Cho Chang Koo | $382,000 | |
| Previous Owner | Cho Chang Koo | $409,000 | |
| Previous Owner | Karafillis Apostolos P | $417,000 | |
| Previous Owner | Cho Chang Koo | $197,000 |
Source: Public Records
Tax History Compared to Growth
Tax History
| Year | Tax Paid | Tax Assessment Tax Assessment Total Assessment is a certain percentage of the fair market value that is determined by local assessors to be the total taxable value of land and additions on the property. | Land | Improvement |
|---|---|---|---|---|
| 2025 | $150 | $1,356,400 | $825,100 | $531,300 |
| 2024 | $14,935 | $1,318,200 | $825,100 | $493,100 |
| 2023 | $14,213 | $1,204,500 | $726,100 | $478,400 |
| 2022 | $14,150 | $1,131,100 | $660,100 | $471,000 |
| 2021 | $13,665 | $1,065,100 | $594,100 | $471,000 |
| 2020 | $13,197 | $1,065,100 | $594,100 | $471,000 |
| 2019 | $12,099 | $999,100 | $528,100 | $471,000 |
| 2018 | $11,394 | $934,700 | $476,900 | $457,800 |
| 2017 | $10,453 | $851,200 | $410,100 | $441,100 |
| 2016 | $9,504 | $813,700 | $386,100 | $427,600 |
| 2015 | $9,682 | $797,500 | $386,100 | $411,400 |
| 2014 | $9,265 | $731,800 | $321,800 | $410,000 |
Source: Public Records
Map
Nearby Homes