
Seller's Agent in 2025
Ling Huang
Greatland Real Estate LLC
(978) 496-5613
8 in this area
23 Total Sales
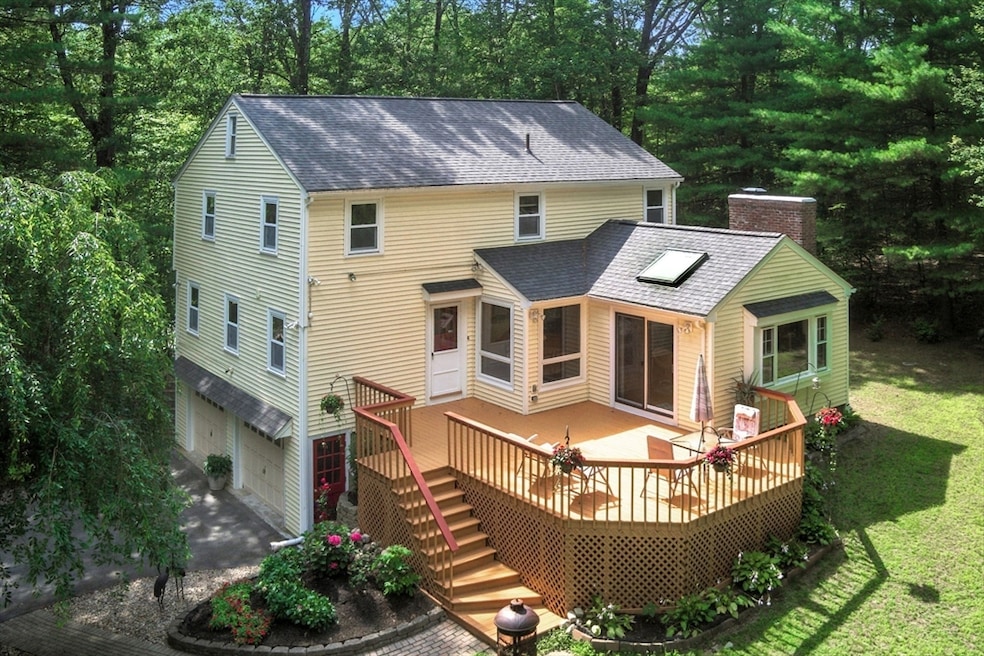
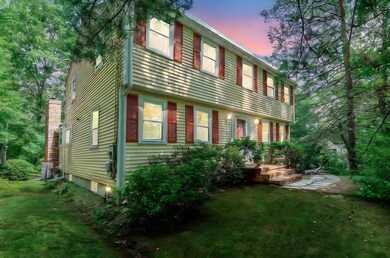
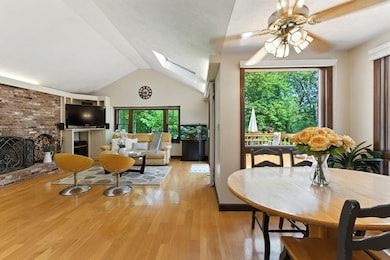
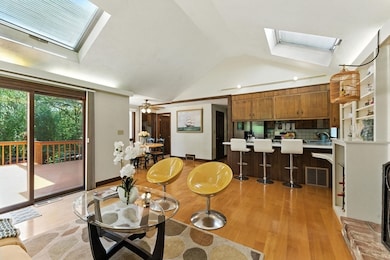
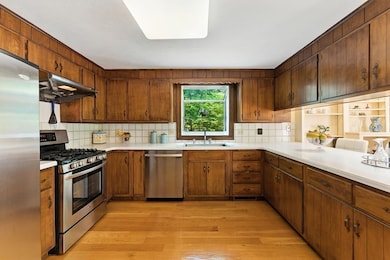
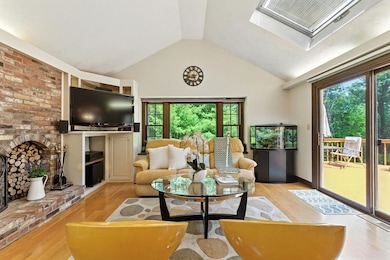
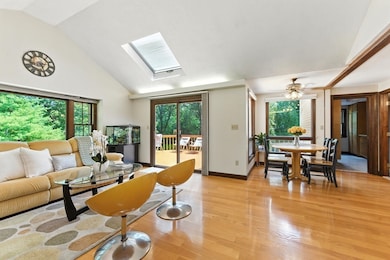
Indulge in suburban living with this meticulously maintained 4-bed, 2.5-bath colonial set back from the road in a sought-after Acton neighborhood. Surrounded by mature trees and lush landscaping, this home offers exceptional privacy and tranquility. Gleaming hardwood floors and a well-designed layout welcome you with sun-filled formal living and dining rooms, and a vaulted family room with fireplace, skylights, and bay window overlooking the serene backyard. The spacious kitchen features an open layout, stainless steel appliances, and Corian countertops. Step onto the expansive deck and enjoy the peaceful yard filled with vibrant gardens, mature greenery, visiting birds and woodland creatures. Upstairs offers a serene primary suite with updated bath, plus 3 freshly painted bedrooms. The finished lower level includes a bonus living area with bar and 2-car garage. Just an 8-minute walk to the commuter rail, close to shops, Route 2, and recreation. Welcome home!!
| Date | Type | Sale Price | Title Company |
|---|---|---|---|
| Quit Claim Deed | $950,000 | -- | |
| Deed | $950,000 | -- | |
| Deed | $487,000 | -- | |
| Deed | $487,000 | -- |
| Date | Status | Loan Amount | Loan Type |
|---|---|---|---|
| Previous Owner | $160,000 | No Value Available | |
| Previous Owner | $200,000 | No Value Available | |
| Previous Owner | $100,000 | Purchase Money Mortgage |
| Date | Event | Price | List to Sale | Price per Sq Ft |
|---|---|---|---|---|
| 08/11/2025 08/11/25 | Sold | $950,000 | +8.6% | $367 / Sq Ft |
| 07/21/2025 07/21/25 | Pending | -- | -- | -- |
| 07/17/2025 07/17/25 | For Sale | $875,000 | -- | $338 / Sq Ft |
| Year | Tax Paid | Tax Assessment Tax Assessment Total Assessment is a certain percentage of the fair market value that is determined by local assessors to be the total taxable value of land and additions on the property. | Land | Improvement |
|---|---|---|---|---|
| 2025 | $12,936 | $754,300 | $324,300 | $430,000 |
| 2024 | $12,117 | $726,900 | $324,300 | $402,600 |
| 2023 | $11,800 | $672,000 | $294,600 | $377,400 |
| 2022 | $11,367 | $584,400 | $256,600 | $327,800 |
| 2021 | $11,080 | $547,700 | $237,200 | $310,500 |
| 2020 | $10,455 | $543,400 | $237,200 | $306,200 |
| 2019 | $9,946 | $513,500 | $237,200 | $276,300 |
| 2018 | $9,783 | $504,800 | $237,200 | $267,600 |
| 2017 | $9,679 | $507,800 | $237,200 | $270,600 |
| 2016 | $9,509 | $494,500 | $237,200 | $257,300 |
| 2015 | $9,272 | $486,700 | $237,200 | $249,500 |
| 2014 | $8,994 | $462,400 | $237,200 | $225,200 |
Seller's Agent in 2025
Ling Huang
Greatland Real Estate LLC
(978) 496-5613
8 in this area
23 Total Sales
Buyer's Agent in 2025
Claire Gauthier
Keller Williams Realty Boston Northwest
(978) 505-0177
5 in this area
26 Total Sales
Source: MLS Property Information Network (MLS PIN)
MLS Number: 73405757
APN: ACTO-000003BH000050-000001
Disclaimer: Certain information contained herein is derived from information provided by parties other than Homes.com. All information provided is deemed reliable, but is not guaranteed to be accurate and should be independently verified.
![]() The property listing data and information, or the Images, set forth herein were provided to MLS Property Information Network, Inc. from third party sources, including sellers, lessors and public records, and were compiled by MLS Property Information Network, Inc. The property listing data and information, and the Images, are for the personal, non-commercial use of consumers having a good faith interest in purchasing or leasing listed properties of the type displayed to them and may not be used for any purpose other than to identify prospective properties which such consumers may have a good faith interest in purchasing or leasing. MLS Property Information Network, Inc. and its subscribers disclaim any and all representations and warranties as to the accuracy of the property listing data and information, or as to the accuracy of any of the Images, set forth herein.
The property listing data and information, or the Images, set forth herein were provided to MLS Property Information Network, Inc. from third party sources, including sellers, lessors and public records, and were compiled by MLS Property Information Network, Inc. The property listing data and information, and the Images, are for the personal, non-commercial use of consumers having a good faith interest in purchasing or leasing listed properties of the type displayed to them and may not be used for any purpose other than to identify prospective properties which such consumers may have a good faith interest in purchasing or leasing. MLS Property Information Network, Inc. and its subscribers disclaim any and all representations and warranties as to the accuracy of the property listing data and information, or as to the accuracy of any of the Images, set forth herein.
Ask me questions while you tour the home.