82 Holbrook Rd Oxford, MA 01540
Estimated Value: $357,000 - $466,000
4
Beds
1
Bath
1,516
Sq Ft
$267/Sq Ft
Est. Value
About This Home
This home is located at 82 Holbrook Rd, Oxford, MA 01540 and is currently estimated at $405,074, approximately $267 per square foot. 82 Holbrook Rd is a home located in Worcester County with nearby schools including Alfred M Chaffee, Oxford High School, and Clara Barton Elementary School.
Ownership History
Date
Name
Owned For
Owner Type
Purchase Details
Closed on
Apr 10, 2017
Sold by
Nelson Nancy E
Bought by
Oxford Nelson Ft
Current Estimated Value
Purchase Details
Closed on
Jan 20, 1994
Sold by
Stgermain Alfred R and Caissie Robert
Bought by
Nelson Arthur E and Nelson Nancy E
Home Financials for this Owner
Home Financials are based on the most recent Mortgage that was taken out on this home.
Original Mortgage
$39,900
Interest Rate
7.08%
Mortgage Type
Purchase Money Mortgage
Create a Home Valuation Report for This Property
The Home Valuation Report is an in-depth analysis detailing your home's value as well as a comparison with similar homes in the area
Home Values in the Area
Average Home Value in this Area
Purchase History
| Date | Buyer | Sale Price | Title Company |
|---|---|---|---|
| Oxford Nelson Ft | -- | -- | |
| Nelson Arthur E | $39,900 | -- |
Source: Public Records
Mortgage History
| Date | Status | Borrower | Loan Amount |
|---|---|---|---|
| Previous Owner | Nelson Arthur E | $39,900 |
Source: Public Records
Tax History Compared to Growth
Tax History
| Year | Tax Paid | Tax Assessment Tax Assessment Total Assessment is a certain percentage of the fair market value that is determined by local assessors to be the total taxable value of land and additions on the property. | Land | Improvement |
|---|---|---|---|---|
| 2025 | $37 | $294,600 | $122,300 | $172,300 |
| 2024 | $3,640 | $270,000 | $113,100 | $156,900 |
| 2023 | $3,639 | $266,800 | $101,000 | $165,800 |
| 2022 | $3,172 | $196,300 | $71,300 | $125,000 |
| 2021 | $2,979 | $180,200 | $67,700 | $112,500 |
| 2020 | $2,799 | $168,000 | $67,700 | $100,300 |
| 2019 | $2,466 | $144,800 | $67,700 | $77,100 |
| 2018 | $2,501 | $144,800 | $67,700 | $77,100 |
| 2017 | $2,499 | $148,300 | $67,700 | $80,600 |
| 2016 | $2,511 | $148,300 | $67,700 | $80,600 |
| 2015 | $2,342 | $148,300 | $67,700 | $80,600 |
| 2014 | $2,295 | $153,000 | $67,700 | $85,300 |
Source: Public Records
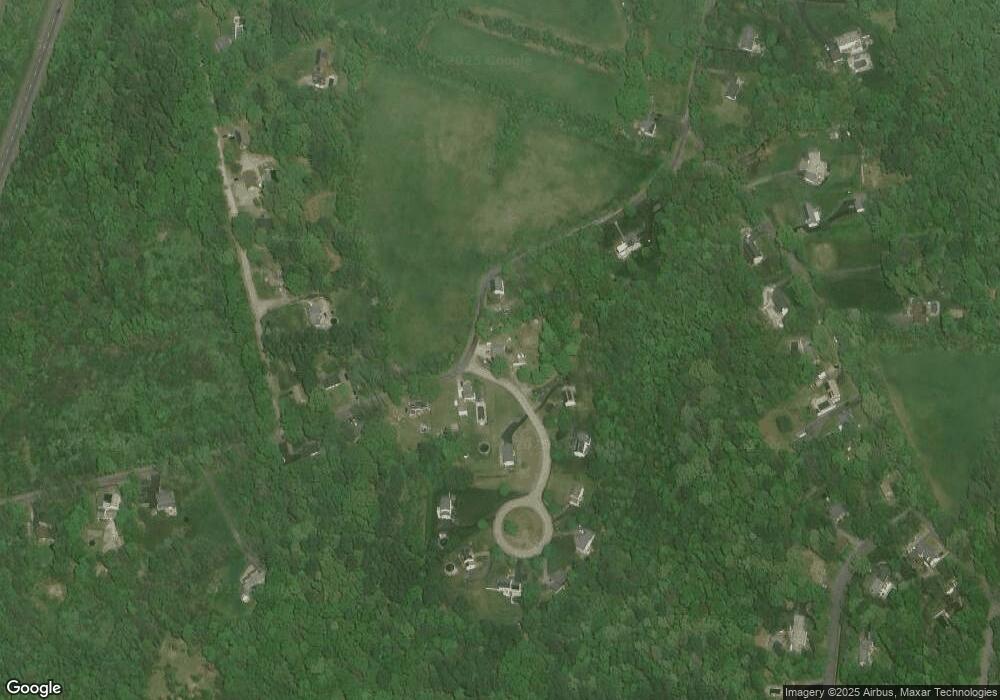
Map
Nearby Homes