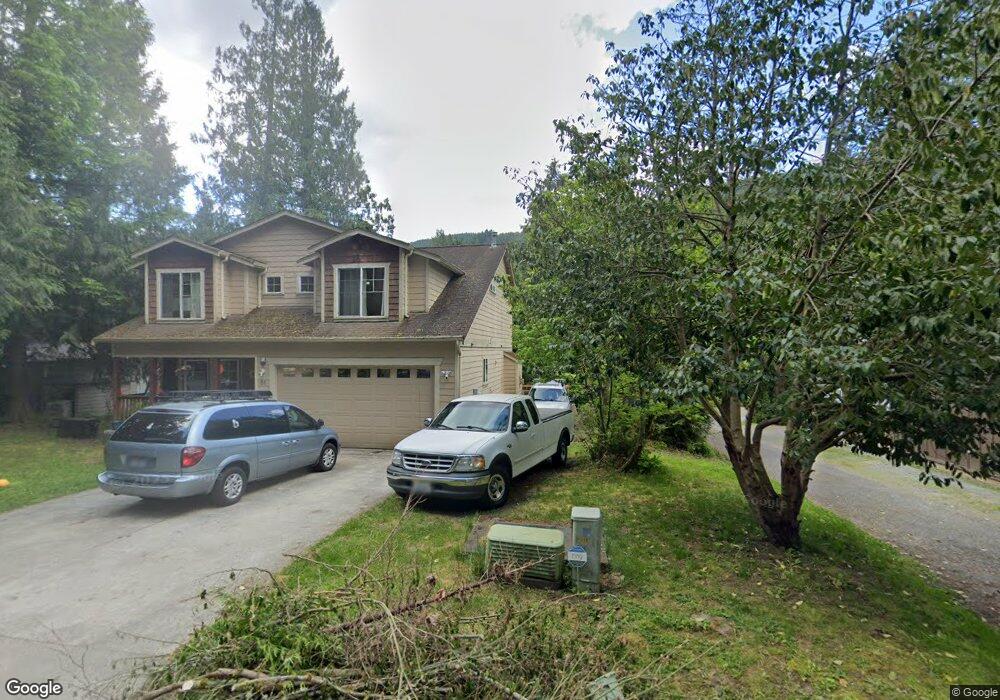
82 Honeycomb Ln Bellingham, WA 98229
Estimated Value: $454,070 - $475,000
3
Beds
2
Baths
1,176
Sq Ft
$396/Sq Ft
Est. Value
About This Home
This home is located at 82 Honeycomb Ln, Bellingham, WA 98229 and is currently estimated at $465,268, approximately $395 per square foot. 82 Honeycomb Ln is a home located in Whatcom County with nearby schools including Geneva Elementary School, Kulshan Middle School, and Bellingham High School.
Ownership History
Date
Name
Owned For
Owner Type
Purchase Details
Closed on
Oct 30, 2008
Sold by
Krebs Johann A and Moreno Maria D
Bought by
Moreno Carlos I and Moreno Sandra A
Current Estimated Value
Home Financials for this Owner
Home Financials are based on the most recent Mortgage that was taken out on this home.
Original Mortgage
$170,000
Interest Rate
5.77%
Mortgage Type
Stand Alone Refi Refinance Of Original Loan
Purchase Details
Closed on
Jul 6, 2005
Sold by
Landeck Carol A
Bought by
Krebs Johann A and Moreno Maria D
Home Financials for this Owner
Home Financials are based on the most recent Mortgage that was taken out on this home.
Original Mortgage
$90,000
Interest Rate
5.58%
Mortgage Type
Fannie Mae Freddie Mac
Create a Home Valuation Report for This Property
The Home Valuation Report is an in-depth analysis detailing your home's value as well as a comparison with similar homes in the area
Home Values in the Area
Average Home Value in this Area
Purchase History
| Date | Buyer | Sale Price | Title Company |
|---|---|---|---|
| Moreno Carlos I | $222,280 | First American Title Ins | |
| Krebs Johann A | $222,280 | Chicago Title Insurance |
Source: Public Records
Mortgage History
| Date | Status | Borrower | Loan Amount |
|---|---|---|---|
| Closed | Moreno Carlos I | $170,000 | |
| Previous Owner | Krebs Johann A | $90,000 |
Source: Public Records
Tax History Compared to Growth
Tax History
| Year | Tax Paid | Tax Assessment Tax Assessment Total Assessment is a certain percentage of the fair market value that is determined by local assessors to be the total taxable value of land and additions on the property. | Land | Improvement |
|---|---|---|---|---|
| 2024 | $3,405 | $383,453 | $168,650 | $214,803 |
| 2023 | $3,405 | $385,795 | $169,680 | $216,115 |
| 2022 | $2,681 | $332,591 | $146,280 | $186,311 |
| 2021 | $2,576 | $241,008 | $106,000 | $135,008 |
| 2020 | $2,498 | $227,366 | $100,000 | $127,366 |
| 2019 | $2,268 | $220,124 | $86,304 | $133,820 |
| 2018 | $2,275 | $206,667 | $81,000 | $125,667 |
| 2017 | $1,919 | $176,595 | $69,188 | $107,407 |
| 2016 | $1,724 | $155,298 | $60,750 | $94,548 |
| 2015 | $1,726 | $146,151 | $57,904 | $88,247 |
| 2014 | -- | $141,977 | $56,250 | $85,727 |
| 2013 | -- | $149,226 | $74,700 | $74,526 |
Source: Public Records
Map
Nearby Homes
- 325 Sudden Valley Dr
- 6 Sugarpine Place
- 8 Morning Glory Dr
- 30 Little Strawberry Ln
- 43 Rocky Ridge Dr
- 46 Sudden Valley Dr
- 56 Sudden Valley Dr
- 63 Valley Crest Way
- 400 Sudden Valley Dr
- 40 Morning Glory Dr
- 3 Louise View Dr
- 16 Sandalwood Cir
- 21 Clematis Ln
- 15 Sudden Valley Dr
- 18 Sweetclover Cir
- 1 Valley Crest Way
- 4 Sweetclover Cir
- 214 Polo Park Dr
- 29 Bramble Way
- 3 Huckleberry Ct Unit B
- 86 Honeycomb Ln
- 88 Honeycomb Ln
- 80 Honeycomb Ln
- 76 Honeycomb Ln
- 90 Honeycomb Ln
- 14 Roy Rd
- 65 Honeycomb Ln
- 67 Honeycomb Ln
- 69 Honeycomb Ln
- 61 Honeycomb Ln
- 77 Honeycomb Ln
- 359 Sudden Valley Dr
- 355 Sudden Valley Dr
- 59 Honeycomb Ln
- 351 Sudden Valley Dr
- 72 Honeycomb Ln
- 92 Honeycomb Ln
- 2 Baywood Ct
- 349 Sudden Valley Dr
- 4 Baywood Ct