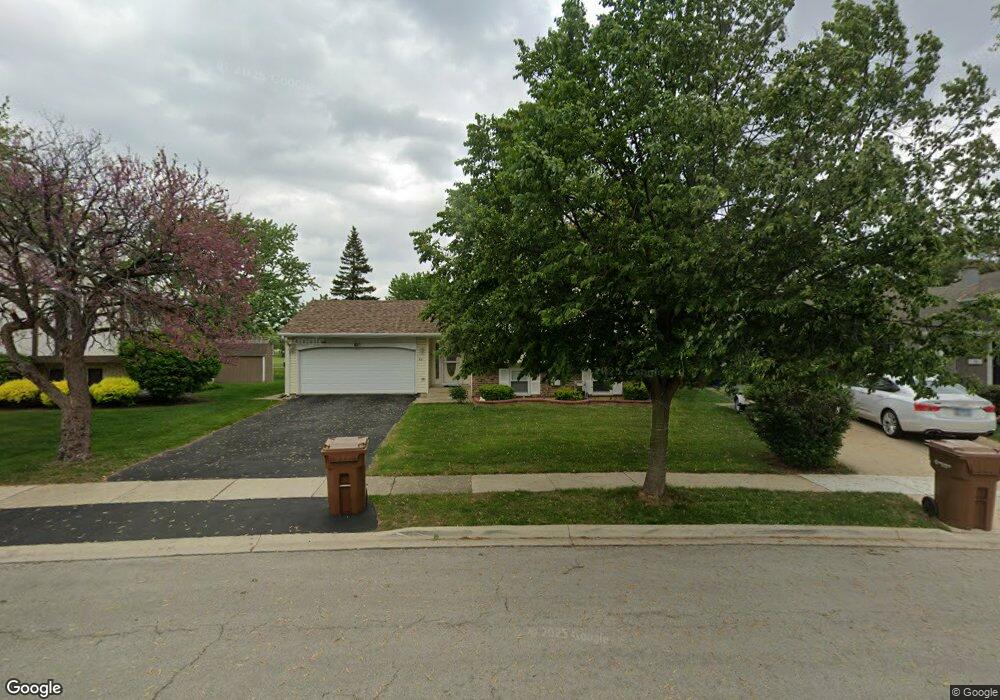
82 Joseph Ln Glendale Heights, IL 60139
Estimated Value: $309,000 - $401,000
4
Beds
2
Baths
1,985
Sq Ft
$182/Sq Ft
Est. Value
About This Home
This home is located at 82 Joseph Ln, Glendale Heights, IL 60139 and is currently estimated at $360,360, approximately $181 per square foot. 82 Joseph Ln is a home located in DuPage County with nearby schools including Glen Hill Primary School, Americana Intermediate School, and Glenside Middle School.
Ownership History
Date
Name
Owned For
Owner Type
Purchase Details
Closed on
Jan 1, 1999
Sold by
Kuruvilla Babu and Babu Annamma
Bought by
Edakkunnathu George and Edakkunnathu Gracy
Current Estimated Value
Home Financials for this Owner
Home Financials are based on the most recent Mortgage that was taken out on this home.
Original Mortgage
$115,600
Outstanding Balance
$26,928
Interest Rate
6.81%
Estimated Equity
$333,432
Purchase Details
Closed on
Jul 25, 1997
Sold by
Naling Frederico P and Naling Jean E
Bought by
Kuruvilla Babu and Babu Annamma
Home Financials for this Owner
Home Financials are based on the most recent Mortgage that was taken out on this home.
Original Mortgage
$136,800
Interest Rate
6.37%
Purchase Details
Closed on
Sep 26, 1994
Sold by
Melowitz Nancy Jean and Melowitz Thomas
Bought by
Naling Frederico P and Naling Jean E
Home Financials for this Owner
Home Financials are based on the most recent Mortgage that was taken out on this home.
Original Mortgage
$122,550
Interest Rate
8.55%
Create a Home Valuation Report for This Property
The Home Valuation Report is an in-depth analysis detailing your home's value as well as a comparison with similar homes in the area
Home Values in the Area
Average Home Value in this Area
Purchase History
| Date | Buyer | Sale Price | Title Company |
|---|---|---|---|
| Edakkunnathu George | $144,500 | Chicago Title Insurance Co | |
| Kuruvilla Babu | $144,000 | -- | |
| Naling Frederico P | $129,000 | Attorneys Natl Title Network |
Source: Public Records
Mortgage History
| Date | Status | Borrower | Loan Amount |
|---|---|---|---|
| Open | Edakkunnathu George | $115,600 | |
| Previous Owner | Kuruvilla Babu | $136,800 | |
| Previous Owner | Naling Frederico P | $122,550 |
Source: Public Records
Tax History Compared to Growth
Tax History
| Year | Tax Paid | Tax Assessment Tax Assessment Total Assessment is a certain percentage of the fair market value that is determined by local assessors to be the total taxable value of land and additions on the property. | Land | Improvement |
|---|---|---|---|---|
| 2024 | $5,613 | $104,287 | $23,915 | $80,372 |
| 2023 | $5,973 | $95,370 | $21,870 | $73,500 |
| 2022 | $6,657 | $83,450 | $19,580 | $63,870 |
| 2021 | $6,656 | $79,280 | $18,600 | $60,680 |
| 2020 | $6,580 | $77,350 | $18,150 | $59,200 |
| 2019 | $6,348 | $74,330 | $17,440 | $56,890 |
| 2018 | $6,062 | $59,890 | $16,980 | $42,910 |
| 2017 | $5,873 | $55,510 | $15,740 | $39,770 |
| 2016 | $5,640 | $51,380 | $14,570 | $36,810 |
| 2015 | $5,529 | $47,950 | $13,600 | $34,350 |
| 2014 | $5,836 | $49,900 | $13,600 | $36,300 |
| 2013 | $5,762 | $51,600 | $14,060 | $37,540 |
Source: Public Records
Map
Nearby Homes
- 118 Windsor Ln
- 179 Glen Hill Dr
- 23W285 Armitage Ave
- 1500 Golfview Ct Unit 5
- 56 N Golfview Ct
- 2N643 Diane Ave
- 108 Golfview Dr
- 10 W Nevada Ave
- 2N061 Bloomingdale Rd
- 1188 Harbor Ct Unit 136
- 134 W Montana Ave
- 203 Ahmed Ct
- 367 Mark Ave
- 1148 Harbor Ct Unit 152
- 200 Ahmed Ct
- 1760 Lombard Ct
- 251 Polo Club Dr
- 426 Norton Ave
- 1160 Cedar St Unit 3A
- 419 Sidney Ave Unit C
- 90 Joseph Ln
- 81 Joseph Ln
- 74 Joseph Ln
- 1468 Van Meter Dr
- 1462 Van Meter Dr
- 69 Joseph Ln
- 94 Joseph Ln
- 70 Joseph Ln
- 93 Joseph Ln
- 94 Jacobsen Ave
- 1456 Van Meter Dr Unit 3
- 65 Joseph Ln
- 66 Joseph Ln
- 72 Jacobsen Ave
- 68 Jacobsen Ave
- 59 Joseph Ln
- 60 Joseph Ln
- 1475 Van Meter Dr Unit 3
- 1465 Van Meter Dr
- 62 Jacobsen Ave