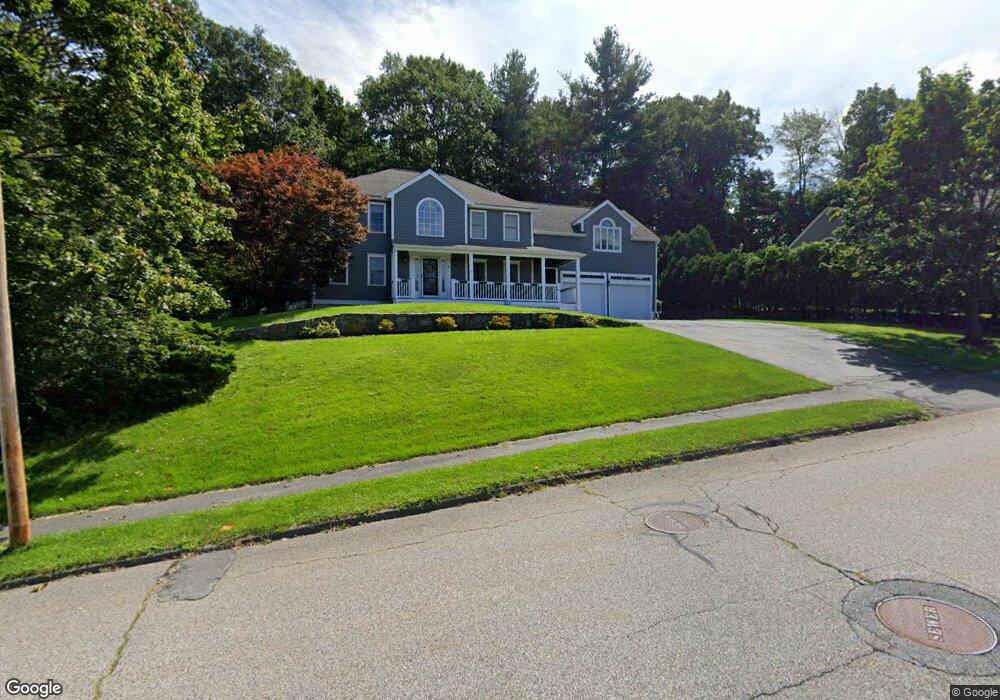
82 Lamplighter Dr Shrewsbury, MA 01545
Estimated Value: $943,000 - $1,162,000
4
Beds
3
Baths
2,827
Sq Ft
$370/Sq Ft
Est. Value
About This Home
This home is located at 82 Lamplighter Dr, Shrewsbury, MA 01545 and is currently estimated at $1,045,273, approximately $369 per square foot. 82 Lamplighter Dr is a home located in Worcester County with nearby schools including Floral Street School, Sherwood Middle School, and Oak Middle School.
Ownership History
Date
Name
Owned For
Owner Type
Purchase Details
Closed on
Oct 16, 2015
Sold by
Berube Van G and Murphy-Berube Krista A
Bought by
Barrette Armand J and Barrette Noel J
Current Estimated Value
Home Financials for this Owner
Home Financials are based on the most recent Mortgage that was taken out on this home.
Original Mortgage
$271,000
Interest Rate
3.88%
Mortgage Type
New Conventional
Purchase Details
Closed on
Mar 29, 2007
Sold by
Bachand Betty A and Bachand Robert C
Bought by
Murphy-Berube Krista A and Berube Van G
Home Financials for this Owner
Home Financials are based on the most recent Mortgage that was taken out on this home.
Original Mortgage
$417,000
Interest Rate
6.33%
Mortgage Type
Purchase Money Mortgage
Purchase Details
Closed on
Aug 7, 1992
Sold by
Carruth Capital Corp
Bought by
Bachand Robert C and Bachand Betty
Create a Home Valuation Report for This Property
The Home Valuation Report is an in-depth analysis detailing your home's value as well as a comparison with similar homes in the area
Home Values in the Area
Average Home Value in this Area
Purchase History
| Date | Buyer | Sale Price | Title Company |
|---|---|---|---|
| Barrette Armand J | $629,425 | -- | |
| Murphy-Berube Krista A | $560,000 | -- | |
| Murphy-Berube Krista A | $560,000 | -- | |
| Murphy-Berube Krista A | $560,000 | -- | |
| Bachand Robert C | $193,090 | -- | |
| Bachand Robert C | $193,090 | -- |
Source: Public Records
Mortgage History
| Date | Status | Borrower | Loan Amount |
|---|---|---|---|
| Closed | Barrette Armand J | $271,000 | |
| Previous Owner | Bachand Robert C | $417,000 | |
| Previous Owner | Murphy-Berube Krista A | $417,000 |
Source: Public Records
Tax History Compared to Growth
Tax History
| Year | Tax Paid | Tax Assessment Tax Assessment Total Assessment is a certain percentage of the fair market value that is determined by local assessors to be the total taxable value of land and additions on the property. | Land | Improvement |
|---|---|---|---|---|
| 2025 | $105 | $872,700 | $292,600 | $580,100 |
| 2024 | $10,560 | $853,000 | $278,600 | $574,400 |
| 2023 | $9,841 | $750,100 | $278,600 | $471,500 |
| 2022 | $9,047 | $641,200 | $247,700 | $393,500 |
| 2021 | $8,089 | $613,300 | $247,700 | $365,600 |
| 2020 | $7,648 | $613,300 | $247,700 | $365,600 |
| 2019 | $7,396 | $588,400 | $238,500 | $349,900 |
| 2018 | $7,207 | $569,300 | $220,200 | $349,100 |
| 2017 | $6,908 | $538,400 | $200,700 | $337,700 |
| 2016 | $6,890 | $530,000 | $189,500 | $340,500 |
| 2015 | $6,729 | $509,800 | $169,300 | $340,500 |
Source: Public Records
Map
Nearby Homes
- 4 Horseneck Rd
- 28 Cherry St
- 60 Harrington Farms Way Unit 60
- 102 Harrington Farms Way
- 39 Old Brook Rd
- Lot 386R Clover Glen Cir
- 9 Arnold Rd
- 18 Eastwood Rd
- 114 Grafton St
- 40 Adams Farm Rd
- 9 Heritage St
- 33 Shady Lane Ave
- 25 Harriet Ave
- 29 Elma Cir
- 468 Grafton St
- 21 Fiske St
- 43 Harriet Ave
- 22 Adams Rd
- 129A&B Maple Ave
- 7 Wesleyan St
- 80 Lamplighter Dr
- 2 Seton Dr
- 5 Comstock Dr
- 7 Comstock Dr
- 83 Lamplighter Dr
- 3 Comstock Dr
- 81 Lamplighter Dr
- 85 Lamplighter Dr
- 86 Lamplighter Dr
- 76 Lamplighter Dr
- 4 Seton Dr
- 3 Seton Dr
- 79 Lamplighter Dr
- 43 Lamplighter Dr
- 45 Lamplighter Dr
- 41 Lamplighter Dr
- 11 Comstock Dr
- 88 Lamplighter Dr
- 6 Comstock Dr
- 4 Comstock Dr