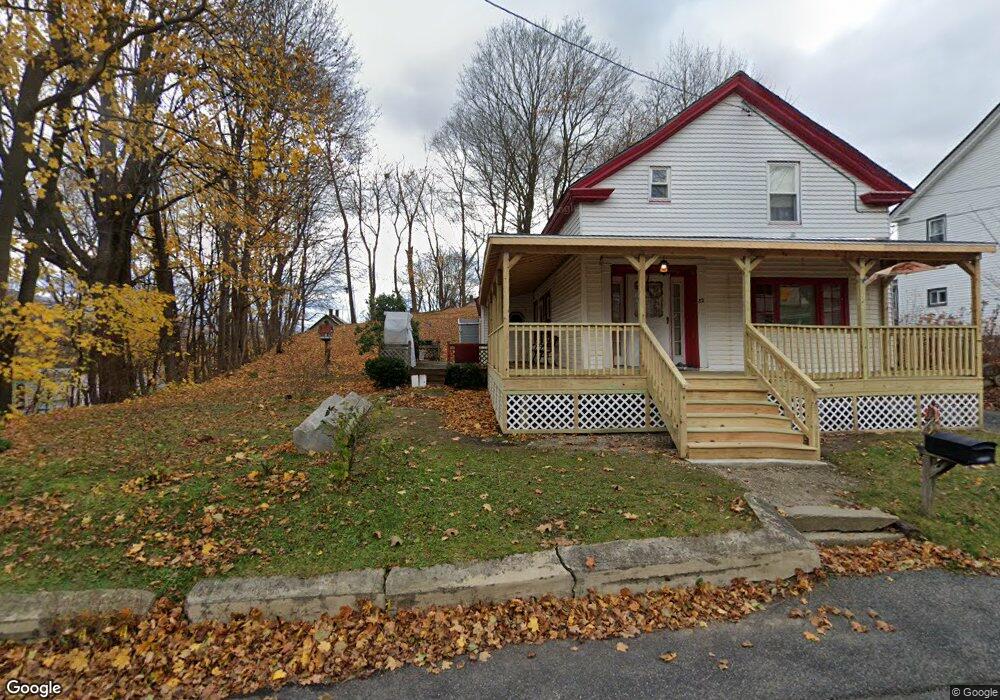
82 Liberty St North Adams, MA 01247
Estimated Value: $197,000 - $235,000
3
Beds
1
Bath
1,742
Sq Ft
$124/Sq Ft
Est. Value
About This Home
This home is located at 82 Liberty St, North Adams, MA 01247 and is currently estimated at $216,065, approximately $124 per square foot. 82 Liberty St is a home located in Berkshire County with nearby schools including Greylock Elementary School and Drury High School.
Ownership History
Date
Name
Owned For
Owner Type
Purchase Details
Closed on
Jul 1, 2011
Sold by
Pnc Mtg
Bought by
Moses Cathleen J
Current Estimated Value
Purchase Details
Closed on
May 12, 2010
Sold by
Mantello Joshua N and Pnc Mortgage
Bought by
Pnc Mortgage
Purchase Details
Closed on
Jul 16, 2007
Sold by
Mckay David and Mckay Mary Lou
Bought by
Mantello Joshua N
Home Financials for this Owner
Home Financials are based on the most recent Mortgage that was taken out on this home.
Original Mortgage
$132,653
Interest Rate
6.48%
Mortgage Type
Purchase Money Mortgage
Purchase Details
Closed on
Dec 4, 1992
Sold by
Kenedy Brian A and Kennedy David R
Bought by
Mckay David and St Pierre Mary Lou
Home Financials for this Owner
Home Financials are based on the most recent Mortgage that was taken out on this home.
Original Mortgage
$45,191
Interest Rate
8.22%
Mortgage Type
Purchase Money Mortgage
Create a Home Valuation Report for This Property
The Home Valuation Report is an in-depth analysis detailing your home's value as well as a comparison with similar homes in the area
Home Values in the Area
Average Home Value in this Area
Purchase History
| Date | Buyer | Sale Price | Title Company |
|---|---|---|---|
| Moses Cathleen J | $43,000 | -- | |
| Pnc Mortgage | $103,500 | -- | |
| Mantello Joshua N | $130,000 | -- | |
| Mckay David | $45,000 | -- | |
| Moses Cathleen J | $43,000 | -- | |
| Pnc Mortgage | $103,500 | -- | |
| Mantello Joshua N | $130,000 | -- | |
| Mckay David | $45,000 | -- |
Source: Public Records
Mortgage History
| Date | Status | Borrower | Loan Amount |
|---|---|---|---|
| Previous Owner | Mantello Joshua N | $132,653 | |
| Previous Owner | Mckay David | $25,650 | |
| Previous Owner | Mckay David | $45,191 |
Source: Public Records
Tax History Compared to Growth
Tax History
| Year | Tax Paid | Tax Assessment Tax Assessment Total Assessment is a certain percentage of the fair market value that is determined by local assessors to be the total taxable value of land and additions on the property. | Land | Improvement |
|---|---|---|---|---|
| 2025 | $3,177 | $190,100 | $34,700 | $155,400 |
| 2024 | $2,982 | $174,000 | $31,800 | $142,200 |
| 2023 | $2,884 | $163,200 | $31,800 | $131,400 |
| 2022 | $2,618 | $141,300 | $31,800 | $109,500 |
| 2021 | $2,436 | $130,900 | $29,400 | $101,500 |
| 2020 | $2,344 | $125,900 | $29,200 | $96,700 |
| 2019 | $2,245 | $117,500 | $29,200 | $88,300 |
| 2018 | $2,160 | $117,500 | $30,800 | $86,700 |
| 2017 | $2,057 | $116,400 | $30,500 | $85,900 |
| 2016 | $1,995 | $114,700 | $30,500 | $84,200 |
| 2015 | $1,931 | $115,700 | $31,500 | $84,200 |
Source: Public Records
Map
Nearby Homes
- 33-35 Hall St
- 66-68 Bracewell Ave
- 62-64 Chase Ave
- 159 Eagle St
- 24 Franklin St
- 20 Wesleyan St
- 22 Marietta St
- 33 Hudson St
- 38 Wesleyan St
- 166 Houghton St
- 35 Jackson St
- 54 Marietta St
- 0 River St
- 19 N Church St Unit 11
- 19 N Church St Unit 14
- 19 N Church St Unit 12
- 19 N Church St Unit 7
- 129-133 Franklin St
- 97 Barth St
- 0 Church St
- 74 Liberty St
- 88-90 Liberty St
- 70 Liberty St Unit 72
- 88 Liberty St Unit 90
- 94 Liberty St Unit 96
- 94 Liberty St Unit U
- 94-96 Liberty St
- 94 Liberty St Unit L
- 96 Liberty St Unit 96
- 71 Liberty St
- 62 Liberty St
- 77 Hall St
- 79 Liberty St
- 69 Hall St Unit 71
- 83 Hall St
- 73 Hall St Unit 75
- 67 Liberty St
- 65 Hall St
- 87 Hall St Unit 89
- 93 Liberty St Unit 95