Estimated Value: $310,397 - $426,000
3
Beds
1
Bath
1,022
Sq Ft
$379/Sq Ft
Est. Value
About This Home
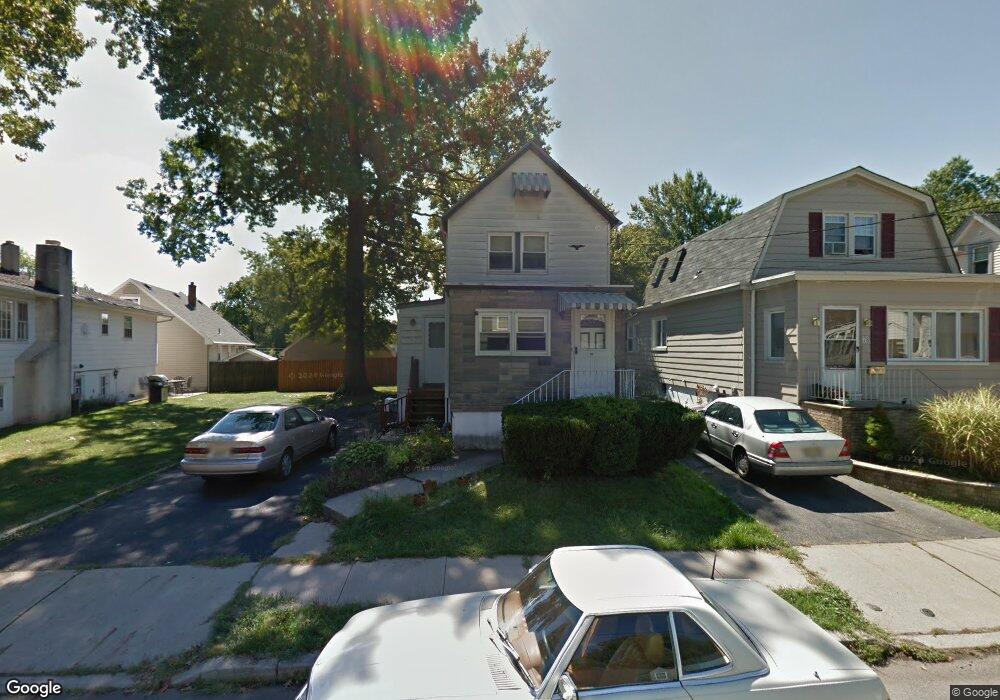
This home is located at 82 Linden St, Fords, NJ 08863 and is currently estimated at $387,599, approximately $379 per square foot. 82 Linden St is a home located in Middlesex County with nearby schools including Ford Avenue Elementary School, Fords Middle School, and Woodbridge High School.
Ownership History
Date
Name
Owned For
Owner Type
Purchase Details
Closed on
Oct 26, 2016
Sold by
51 Holly Road Associates Llc
Bought by
Daley David E
Current Estimated Value
Home Financials for this Owner
Home Financials are based on the most recent Mortgage that was taken out on this home.
Original Mortgage
$147,060
Outstanding Balance
$118,064
Interest Rate
3.42%
Mortgage Type
New Conventional
Estimated Equity
$269,535
Purchase Details
Closed on
May 12, 2016
Sold by
Aspire Federal Credit Uni On and Faa Eastern Region Fcu
Bought by
51 Holly Road Associates Llc
Home Financials for this Owner
Home Financials are based on the most recent Mortgage that was taken out on this home.
Interest Rate
3.57%
Purchase Details
Closed on
Jun 24, 2015
Sold by
Cleary John R and Cleary Barbara T
Bought by
Faa Eastern Region Fcu and Aspire Fcu
Create a Home Valuation Report for This Property
The Home Valuation Report is an in-depth analysis detailing your home's value as well as a comparison with similar homes in the area
Home Values in the Area
Average Home Value in this Area
Purchase History
| Date | Buyer | Sale Price | Title Company |
|---|---|---|---|
| Daley David E | $154,800 | Foundation Title | |
| 51 Holly Road Associates Llc | $100,000 | -- | |
| Faa Eastern Region Fcu | -- | None Available |
Source: Public Records
Mortgage History
| Date | Status | Borrower | Loan Amount |
|---|---|---|---|
| Open | Daley David E | $147,060 | |
| Previous Owner | 51 Holly Road Associates Llc | -- |
Source: Public Records
Tax History Compared to Growth
Tax History
| Year | Tax Paid | Tax Assessment Tax Assessment Total Assessment is a certain percentage of the fair market value that is determined by local assessors to be the total taxable value of land and additions on the property. | Land | Improvement |
|---|---|---|---|---|
| 2025 | $6,238 | $49,400 | $14,400 | $35,000 |
| 2024 | $6,056 | $49,400 | $14,400 | $35,000 |
| 2023 | $6,056 | $49,400 | $14,400 | $35,000 |
| 2022 | $5,893 | $49,400 | $14,400 | $35,000 |
| 2021 | $5,832 | $49,400 | $14,400 | $35,000 |
| 2020 | $5,642 | $49,400 | $14,400 | $35,000 |
| 2019 | $5,497 | $49,400 | $14,400 | $35,000 |
| 2018 | $6,523 | $59,800 | $14,400 | $45,400 |
| 2017 | $6,408 | $59,800 | $14,400 | $45,400 |
| 2016 | $6,356 | $59,800 | $14,400 | $45,400 |
| 2015 | $5,982 | $59,800 | $14,400 | $45,400 |
| 2014 | $5,846 | $59,800 | $14,400 | $45,400 |
Source: Public Records
Map
Nearby Homes