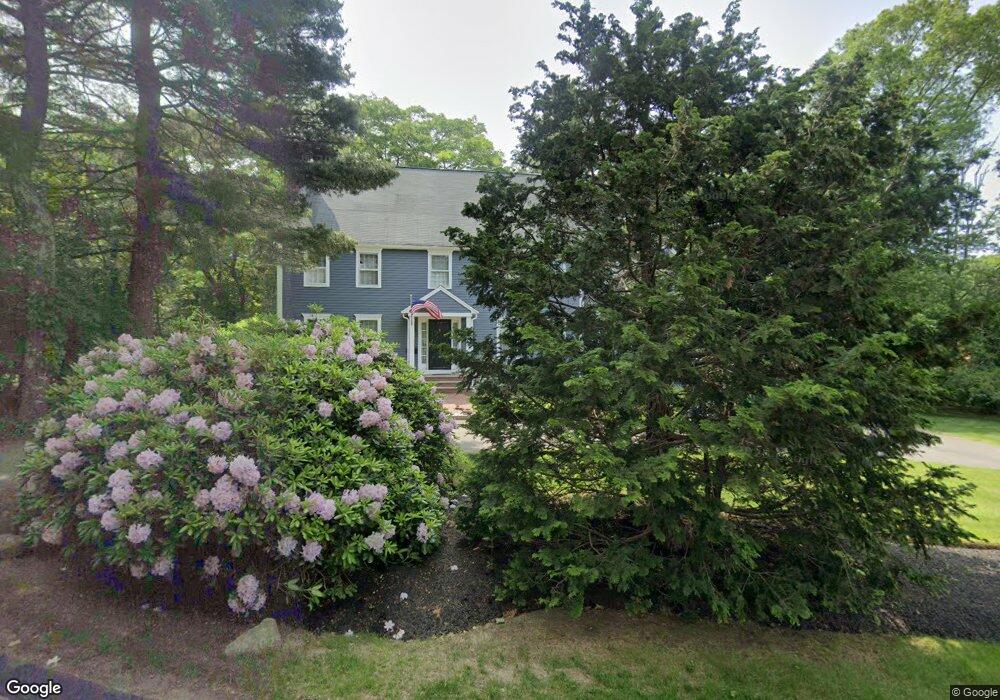
82 Lowder St Dedham, MA 02026
Dexter NeighborhoodEstimated Value: $1,839,101 - $2,150,000
5
Beds
5
Baths
3,685
Sq Ft
$549/Sq Ft
Est. Value
About This Home
This home is located at 82 Lowder St, Dedham, MA 02026 and is currently estimated at $2,021,275, approximately $548 per square foot. 82 Lowder St is a home located in Norfolk County with nearby schools including Riverdale Elementary School, Dedham Middle School, and Dedham High School.
Ownership History
Date
Name
Owned For
Owner Type
Purchase Details
Closed on
Jan 14, 2005
Sold by
Lowder Street Rt
Bought by
Mcgrail Christine C and Mcgrail James F
Current Estimated Value
Home Financials for this Owner
Home Financials are based on the most recent Mortgage that was taken out on this home.
Original Mortgage
$646,750
Outstanding Balance
$327,829
Interest Rate
5.81%
Mortgage Type
Purchase Money Mortgage
Estimated Equity
$1,693,446
Create a Home Valuation Report for This Property
The Home Valuation Report is an in-depth analysis detailing your home's value as well as a comparison with similar homes in the area
Home Values in the Area
Average Home Value in this Area
Purchase History
| Date | Buyer | Sale Price | Title Company |
|---|---|---|---|
| Mcgrail Christine C | $995,000 | -- |
Source: Public Records
Mortgage History
| Date | Status | Borrower | Loan Amount |
|---|---|---|---|
| Open | Mcgrail Christine C | $646,750 |
Source: Public Records
Tax History
| Year | Tax Paid | Tax Assessment Tax Assessment Total Assessment is a certain percentage of the fair market value that is determined by local assessors to be the total taxable value of land and additions on the property. | Land | Improvement |
|---|---|---|---|---|
| 2025 | $22,151 | $1,755,200 | $573,100 | $1,182,100 |
| 2024 | $20,058 | $1,604,600 | $497,600 | $1,107,000 |
| 2023 | $17,758 | $1,383,000 | $430,500 | $952,500 |
| 2022 | $16,822 | $1,260,100 | $430,500 | $829,600 |
| 2021 | $15,388 | $1,125,700 | $390,100 | $735,600 |
| 2020 | $15,814 | $1,152,600 | $393,000 | $759,600 |
| 2019 | $15,888 | $1,122,800 | $414,000 | $708,800 |
| 2018 | $16,942 | $1,164,400 | $455,600 | $708,800 |
| 2017 | $15,204 | $1,030,100 | $361,900 | $668,200 |
| 2016 | $15,461 | $998,100 | $316,600 | $681,500 |
| 2015 | $16,367 | $1,031,300 | $417,200 | $614,100 |
| 2014 | $16,030 | $996,900 | $417,200 | $579,700 |
Source: Public Records
Map
Nearby Homes
- 165 Highland St Unit 165
- 37 Horrigan Dr Unit 1
- 57 Horrigan Dr Unit 3
- 107 Horrigan Dr Unit 12
- 66 Horrigan Dr Unit 25
- 86 Horrigan Dr Unit 23
- 80 Horrigan Dr Unit 24
- 87 Horrigan Dr Unit 8
- 44 Court St
- 55 Church St Unit 1
- 46 Church St
- 213 Sandy Valley Rd
- 92 Old River Place
- 1133 High
- 20-35 Shuttleworth Place
- 20 Shuttleworth Place
- 223 Robert Rd
- 35 Shuttleworth Place
- 262 Meadowbrook Rd
- 58 Jersey St
- 100 Lowder St
- 66 Lowder St
- 40 Sawyer Dr
- 18 Sawyer Dr
- 44 Sawyer Dr
- 56 Sawyer Dr
- 21 Sawyer Dr
- 41 Sawyer Dr
- 58 Sunnyside Ave Continue Solaris
- 26 Lowder St
- 67 Sawyer Dr
- 21 Lowder St
- 55 Sawyer Drive:precinct 1
- 55 Sawyer Dr
- 141 Highland St
- 159 Lowder St
- 165 Highland St Unit 2
- 165 Highland St
- 73 Stoney Lea Rd
- 122 Horrigan Dr Unit 18
Your Personal Tour Guide
Ask me questions while you tour the home.