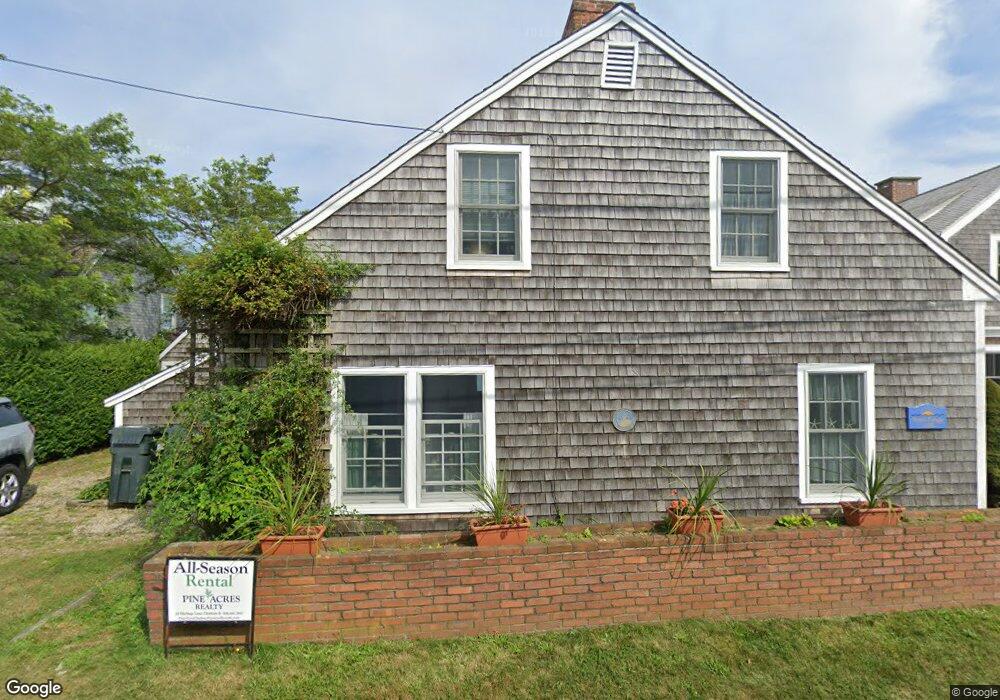
82 Main St Chatham, MA 02633
Chatham Village NeighborhoodEstimated Value: $2,998,000 - $5,046,000
3
Beds
2
Baths
1,020
Sq Ft
$3,637/Sq Ft
Est. Value
About This Home
This home is located at 82 Main St, Chatham, MA 02633 and is currently estimated at $3,710,038, approximately $3,637 per square foot. 82 Main St is a home located in Barnstable County with nearby schools including Chatham Elementary School, Harwich Elementary School, and Monomoy Regional Middle School.
Ownership History
Date
Name
Owned For
Owner Type
Purchase Details
Closed on
May 27, 2010
Sold by
Ellen Bacon Mckinley R
Bought by
Ellen Bacon Mckinley R
Current Estimated Value
Purchase Details
Closed on
Sep 1, 2004
Sold by
Mckinley Nt
Bought by
Ellen Bacon Mckinley L
Create a Home Valuation Report for This Property
The Home Valuation Report is an in-depth analysis detailing your home's value as well as a comparison with similar homes in the area
Home Values in the Area
Average Home Value in this Area
Purchase History
| Date | Buyer | Sale Price | Title Company |
|---|---|---|---|
| Ellen Bacon Mckinley R | -- | -- | |
| Ellen Bacon Mckinley L | -- | -- |
Source: Public Records
Tax History Compared to Growth
Tax History
| Year | Tax Paid | Tax Assessment Tax Assessment Total Assessment is a certain percentage of the fair market value that is determined by local assessors to be the total taxable value of land and additions on the property. | Land | Improvement |
|---|---|---|---|---|
| 2025 | $14,744 | $4,249,000 | $3,964,100 | $284,900 |
| 2024 | $14,312 | $4,009,000 | $3,739,700 | $269,300 |
| 2023 | $13,011 | $3,353,300 | $3,116,200 | $237,100 |
| 2022 | $9,167 | $1,984,200 | $1,804,100 | $180,100 |
| 2021 | $8,996 | $1,806,500 | $1,639,900 | $166,600 |
| 2020 | $8,705 | $1,806,100 | $1,639,900 | $166,200 |
| 2019 | $8,252 | $1,701,500 | $1,533,000 | $168,500 |
| 2018 | $8,213 | $1,686,400 | $1,533,000 | $153,400 |
| 2017 | $8,235 | $1,637,200 | $1,488,100 | $149,100 |
| 2016 | $8,019 | $1,597,500 | $1,459,100 | $138,400 |
| 2015 | $7,746 | $1,552,300 | $1,417,800 | $134,500 |
| 2014 | $11,754 | $2,313,800 | $2,181,200 | $132,600 |
Source: Public Records
Map
Nearby Homes
- 213 Main St
- 32 Sunset Ln
- 409 Main St
- 425 Main St Unit D
- 425 Main St Unit D
- 3 Oyster Dr
- 450 Main St
- 346 Morris Island Rd
- 292 Stage Harbor Rd
- 404 Stage Harbor Rd
- 12 Pond St
- 85 Cedar St
- 745 Main St
- 86 Champlain Rd
- 287 Cedar St
- 92 Barcliff Ave
- 230 Barcliff Ave
- 127 Wapoos Trail
- 99 Uncle Alberts Drive Extension
- 27 Martha Kendrick Dr
- 80 Main St
- 94 Main St
- 74 Main St
- 72 Main St
- 99 Main St
- 73 Main St Unit 11
- 73 Main St Unit 10
- 73 Main St Unit 9
- 73 Main St Unit 8
- 73 Main St Unit 7
- 73 Main St Unit 6
- 73 Main St Unit 5
- 73 Main St Unit 4
- 73 Main St Unit 3
- 73 Main St Unit 2
- 73 Main St Unit 1
- 73 Main St
- 102 Main St
- 107 Main St
- 75 Main St