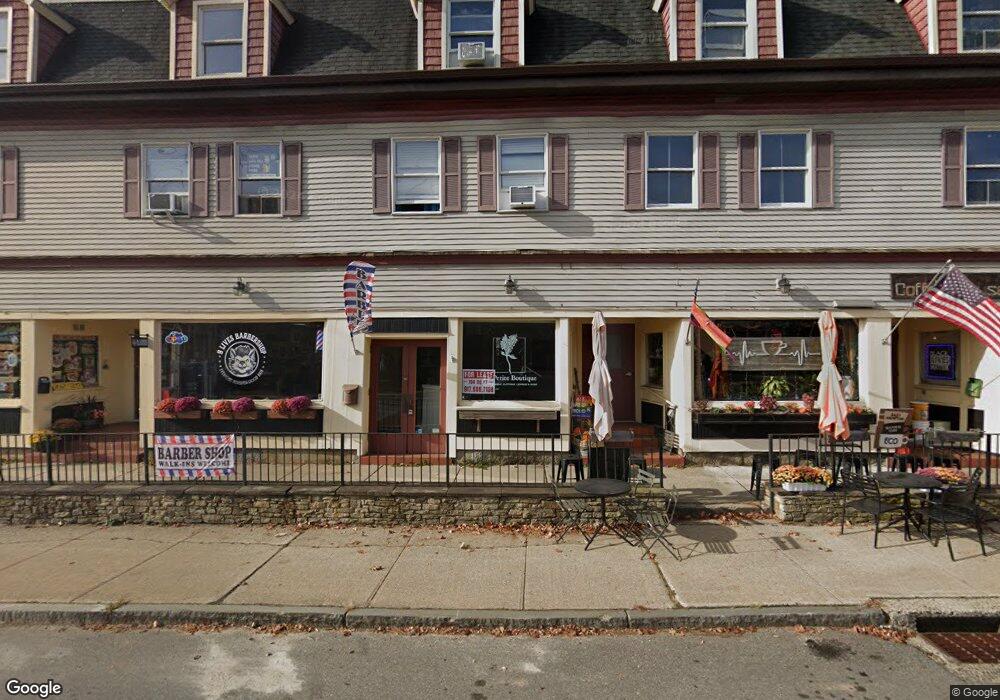
82 Main St East Hampton, CT 06424
Estimated Value: $2,282,427
2
Beds
--
Bath
594
Sq Ft
$3,842/Sq Ft
Est. Value
About This Home
Stunning remodeled units available now! Call/text manager for details! Don't miss out on this opportunity!
Ownership History
Date
Name
Owned For
Owner Type
Purchase Details
Closed on
Sep 28, 2022
Sold by
Edge Properties 1 Llc
Bought by
Bop Equities Llc
Current Estimated Value
Purchase Details
Closed on
Dec 16, 2016
Sold by
R & S East Hampton Vlg 1
Bought by
R & S East Hampton Vlg 1
Home Financials for this Owner
Home Financials are based on the most recent Mortgage that was taken out on this home.
Original Mortgage
$1,319,000
Interest Rate
3.54%
Mortgage Type
Commercial
Purchase Details
Closed on
Oct 1, 2012
Sold by
R & S Realty Advisors Ll
Bought by
R & S East Hampton Villa
Purchase Details
Closed on
Jan 8, 2007
Sold by
Carreiro Frank E
Bought by
82 Main Street Ehmp Ll
Purchase Details
Closed on
Jun 17, 2002
Sold by
Talevi Arnold J and Talevi Kathlyn A
Bought by
Carreiro Frank E
Purchase Details
Closed on
Sep 26, 1996
Sold by
Talevi Arnold J and Talevi Kathlyn A
Bought by
Carreiro Frank E
Create a Home Valuation Report for This Property
The Home Valuation Report is an in-depth analysis detailing your home's value as well as a comparison with similar homes in the area
Home Values in the Area
Average Home Value in this Area
Purchase History
| Date | Buyer | Sale Price | Title Company |
|---|---|---|---|
| Bop Equities Llc | $1,823,100 | None Available | |
| Bop Equities Llc | $1,823,100 | None Available | |
| Bop Equities Llc | $1,823,100 | None Available | |
| Bop Equities Llc | $1,823,100 | None Available | |
| Bop Equities Llc | $1,823,100 | None Available | |
| Bop Equities Llc | $1,823,100 | None Available | |
| R & S East Hampton Vlg 1 | -- | -- | |
| R & S East Hampton Vlg 1 | -- | -- | |
| R & S East Hampton Vlg 1 | -- | -- | |
| R & S East Hampton Vlg 1 | -- | -- | |
| R & S East Hampton Vlg 1 | -- | -- | |
| R & S East Hampton Vlg 1 | -- | -- | |
| R & S East Hampton Villa | -- | -- | |
| R & S East Hampton Villa | -- | -- | |
| R & S Realty Advisors Ll | $600,000 | -- | |
| R & S East Hampton Villa | -- | -- | |
| R & S East Hampton Villa | -- | -- | |
| R & S Realty Advisors Ll | $600,000 | -- | |
| 82 Main Street Ehmp Ll | $1,000,000 | -- | |
| 82 Main Street Ehmp Ll | $1,000,000 | -- | |
| 82 Main Street Ehmp Ll | $1,000,000 | -- | |
| 82 Main Street Ehmp Ll | $1,000,000 | -- | |
| Carreiro Frank E | $176,000 | -- | |
| Carreiro Frank E | $176,000 | -- | |
| Carreiro Frank E | $176,000 | -- | |
| Carreiro Frank E | $176,000 | -- | |
| Carreiro Frank E | $176,000 | -- | |
| Carreiro Frank E | $176,000 | -- | |
| Carreiro Frank E | $176,000 | -- | |
| Carreiro Frank E | $176,000 | -- |
Source: Public Records
Mortgage History
| Date | Status | Borrower | Loan Amount |
|---|---|---|---|
| Previous Owner | R & S East Hampton Vlg 1 | $1,319,000 |
Source: Public Records
Property History
| Date | Event | Price | List to Sale | Price per Sq Ft |
|---|---|---|---|---|
| 05/27/2025 05/27/25 | Off Market | $1,400 | -- | -- |
| 05/13/2025 05/13/25 | Price Changed | $1,400 | -17.6% | $2 / Sq Ft |
| 05/12/2025 05/12/25 | Price Changed | $1,700 | +21.4% | $3 / Sq Ft |
| 04/22/2025 04/22/25 | For Rent | $1,400 | 0.0% | -- |
| 12/19/2023 12/19/23 | Price Changed | $1,400 | +3.7% | $2 / Sq Ft |
| 09/28/2023 09/28/23 | Price Changed | $1,350 | -10.0% | $2 / Sq Ft |
| 09/08/2023 09/08/23 | For Rent | $1,500 | -- | -- |
Tax History
| Year | Tax Paid | Tax Assessment Tax Assessment Total Assessment is a certain percentage of the fair market value that is determined by local assessors to be the total taxable value of land and additions on the property. | Land | Improvement |
|---|---|---|---|---|
| 2025 | $37,385 | $941,450 | $237,650 | $703,800 |
| 2024 | $35,813 | $941,450 | $237,650 | $703,800 |
| 2023 | $33,949 | $941,450 | $237,650 | $703,800 |
| 2022 | $32,631 | $941,450 | $237,650 | $703,800 |
| 2021 | $32,508 | $941,450 | $237,650 | $703,800 |
| 2020 | $24,270 | $732,360 | $81,480 | $650,880 |
| 2019 | $24,270 | $732,360 | $81,480 | $650,880 |
| 2018 | $22,938 | $732,360 | $81,480 | $650,880 |
| 2017 | $22,938 | $732,360 | $81,480 | $650,880 |
| 2016 | $21,561 | $732,360 | $81,480 | $650,880 |
| 2015 | $20,171 | $726,090 | $89,040 | $637,050 |
| 2014 | $17,550 | $726,090 | $89,040 | $637,050 |
Source: Public Records
Map
Nearby Homes
- 29 Watrous St
- 4 Watrous St
- 1 Watrous St
- 14 Main St
- 24 N Main St
- 10 Fairlawn Ave
- 2 Dogwood Dr
- 1 Young St
- 95 Tarragon Dr
- 68 Colchester Ave
- 104 Lake Vista Dr Unit 104
- 18 Lake Blvd
- 0002-6 Edgewater Cir
- 0002-5 Edgewater Cir
- 0002-7 Edgewater Cir
- 00023 Edgewater Cir
- 0002-3 Edgewater Cir
- 00025 Edgewater Cir
- 38 Old Middletown Ave
- 00026 Edgewater Cir
Your Personal Tour Guide
Ask me questions while you tour the home.