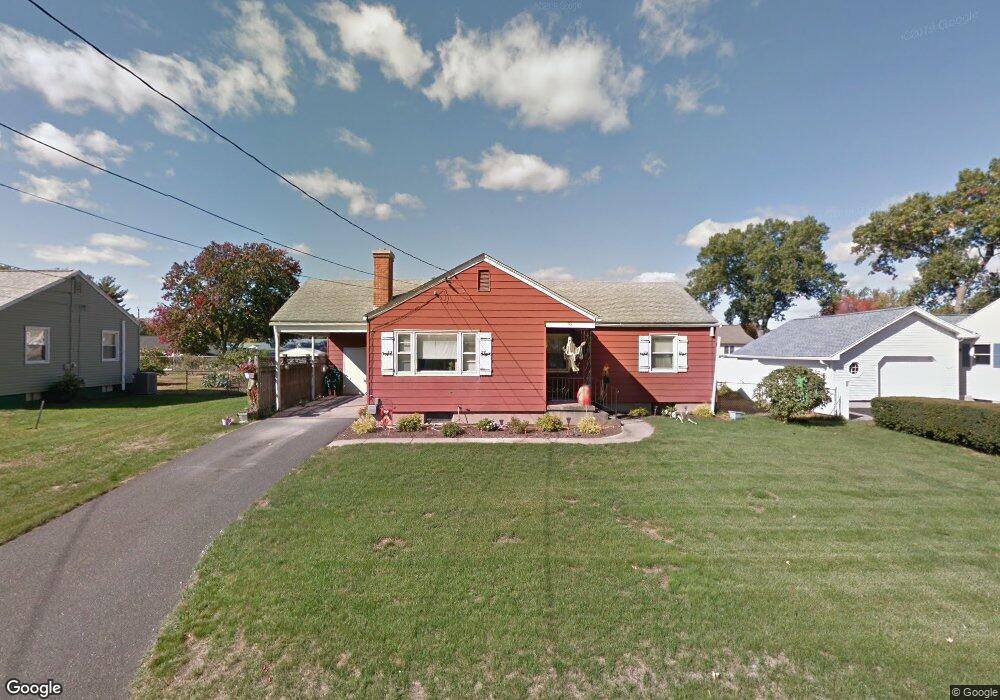
82 Mandalay Rd Chicopee, MA 01020
Fairview NeighborhoodEstimated Value: $240,000 - $316,328
3
Beds
1
Bath
1,048
Sq Ft
$269/Sq Ft
Est. Value
About This Home
This home is located at 82 Mandalay Rd, Chicopee, MA 01020 and is currently estimated at $282,332, approximately $269 per square foot. 82 Mandalay Rd is a home located in Hampden County with nearby schools including Bowie Elementary School, Fairview Middle School, and Chicopee Comprehensive High School.
Ownership History
Date
Name
Owned For
Owner Type
Purchase Details
Closed on
Jan 20, 2021
Sold by
Dunne Fleurette J Est
Bought by
Campos Jessica
Current Estimated Value
Home Financials for this Owner
Home Financials are based on the most recent Mortgage that was taken out on this home.
Original Mortgage
$105,000
Outstanding Balance
$93,713
Interest Rate
2.71%
Mortgage Type
Purchase Money Mortgage
Estimated Equity
$188,619
Purchase Details
Closed on
Jul 6, 2011
Sold by
Fleury John F and Fleury Diane M
Bought by
Dunne Kevin J
Create a Home Valuation Report for This Property
The Home Valuation Report is an in-depth analysis detailing your home's value as well as a comparison with similar homes in the area
Home Values in the Area
Average Home Value in this Area
Purchase History
| Date | Buyer | Sale Price | Title Company |
|---|---|---|---|
| Campos Jessica | $150,000 | None Available | |
| Dunne Kevin J | $190,000 | -- |
Source: Public Records
Mortgage History
| Date | Status | Borrower | Loan Amount |
|---|---|---|---|
| Open | Campos Jessica | $105,000 |
Source: Public Records
Tax History Compared to Growth
Tax History
| Year | Tax Paid | Tax Assessment Tax Assessment Total Assessment is a certain percentage of the fair market value that is determined by local assessors to be the total taxable value of land and additions on the property. | Land | Improvement |
|---|---|---|---|---|
| 2025 | $4,077 | $268,900 | $110,800 | $158,100 |
| 2024 | $3,870 | $262,200 | $108,600 | $153,600 |
| 2023 | $3,597 | $237,400 | $98,700 | $138,700 |
| 2022 | $3,446 | $202,800 | $85,800 | $117,000 |
| 2021 | $3,334 | $189,300 | $78,000 | $111,300 |
| 2020 | $3,218 | $184,300 | $80,100 | $104,200 |
| 2019 | $3,183 | $177,200 | $80,100 | $97,100 |
| 2018 | $3,111 | $169,900 | $76,300 | $93,600 |
| 2017 | $2,984 | $172,400 | $70,000 | $102,400 |
| 2016 | $2,949 | $174,400 | $70,000 | $104,400 |
| 2015 | $2,815 | $160,500 | $70,000 | $90,500 |
| 2014 | $1,320 | $160,500 | $70,000 | $90,500 |
Source: Public Records
Map
Nearby Homes
- 98 Greenpoint Cir
- 81 Mccarthy Ave
- 40 Greenwood Terrace
- 29 Meadowlark Ln
- 71 Greenwood Terrace
- 16 Collins St Unit 16
- 24 Blanchard St
- 97 Collins St
- 90 Anson St
- 103 Collins St
- 82 Mitchell Dr
- 1183 James St
- 15 Hudson Ave
- 34 Deslauriers St
- 311 Montcalm St
- 68 7th Ave
- 519 Prospect St
- 17 Yorktown Ct
- 80 Ann St
- 1640 Westover Rd