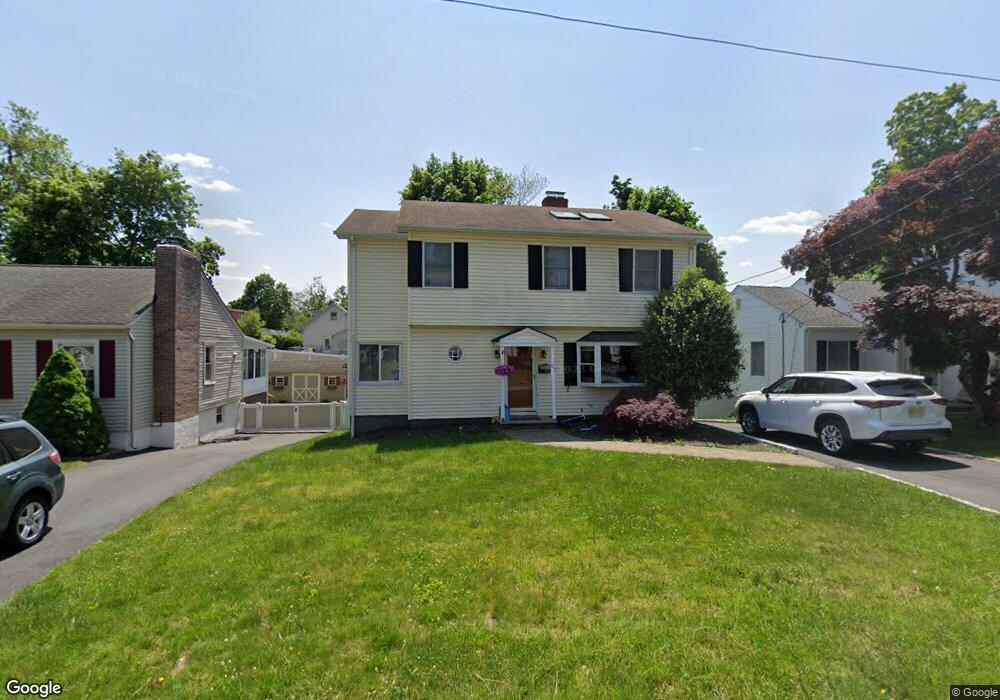
82 Maple Ave Morris Plains, NJ 07950
Estimated Value: $765,000 - $884,000
--
Bed
--
Bath
2,093
Sq Ft
$392/Sq Ft
Est. Value
About This Home
This home is located at 82 Maple Ave, Morris Plains, NJ 07950 and is currently estimated at $820,098, approximately $391 per square foot. 82 Maple Ave is a home located in Morris County with nearby schools including Mountain Way Elementary School, Borough School, and Cheder Lubavitch.
Ownership History
Date
Name
Owned For
Owner Type
Purchase Details
Closed on
Dec 28, 2011
Sold by
Chupak Jason and Chupak Kimberly
Bought by
Hahn Justin and Hahn Cecylia
Current Estimated Value
Home Financials for this Owner
Home Financials are based on the most recent Mortgage that was taken out on this home.
Original Mortgage
$409,353
Outstanding Balance
$280,909
Interest Rate
4%
Mortgage Type
FHA
Estimated Equity
$539,189
Purchase Details
Closed on
Apr 28, 2000
Sold by
Creo Vincent and Forte Creo Valerie
Bought by
Chupak Jason and Chupak Kimberly
Home Financials for this Owner
Home Financials are based on the most recent Mortgage that was taken out on this home.
Original Mortgage
$238,800
Interest Rate
7.62%
Mortgage Type
Stand Alone First
Purchase Details
Closed on
Jun 8, 1994
Sold by
Scala Ralph
Bought by
Creo Vincent and Creo Valerie
Home Financials for this Owner
Home Financials are based on the most recent Mortgage that was taken out on this home.
Original Mortgage
$188,000
Interest Rate
8.29%
Create a Home Valuation Report for This Property
The Home Valuation Report is an in-depth analysis detailing your home's value as well as a comparison with similar homes in the area
Home Values in the Area
Average Home Value in this Area
Purchase History
| Date | Buyer | Sale Price | Title Company |
|---|---|---|---|
| Hahn Justin | $420,000 | None Available | |
| Chupak Jason | $298,500 | First American Title Ins Co | |
| Creo Vincent | $235,000 | -- |
Source: Public Records
Mortgage History
| Date | Status | Borrower | Loan Amount |
|---|---|---|---|
| Open | Hahn Justin | $409,353 | |
| Previous Owner | Chupak Jason | $238,800 | |
| Previous Owner | Creo Vincent | $188,000 |
Source: Public Records
Tax History Compared to Growth
Tax History
| Year | Tax Paid | Tax Assessment Tax Assessment Total Assessment is a certain percentage of the fair market value that is determined by local assessors to be the total taxable value of land and additions on the property. | Land | Improvement |
|---|---|---|---|---|
| 2025 | $11,718 | $472,100 | $231,200 | $240,900 |
| 2024 | $11,798 | $472,100 | $231,200 | $240,900 |
| 2023 | $11,798 | $472,100 | $231,200 | $240,900 |
| 2022 | $11,562 | $472,100 | $231,200 | $240,900 |
| 2021 | $11,562 | $472,100 | $231,200 | $240,900 |
| 2020 | $11,274 | $472,100 | $231,200 | $240,900 |
| 2019 | $11,057 | $472,100 | $231,200 | $240,900 |
| 2018 | $10,698 | $472,100 | $231,200 | $240,900 |
| 2017 | $10,485 | $472,100 | $231,200 | $240,900 |
| 2016 | $10,117 | $472,100 | $231,200 | $240,900 |
| 2015 | $10,164 | $472,100 | $231,200 | $240,900 |
| 2014 | $10,046 | $472,100 | $231,200 | $240,900 |
Source: Public Records
Map
Nearby Homes
- 41 Hawthorne Ave
- 16 Homer Ave
- 125 Glenbrook Rd
- 58 Stiles Ave
- 113 Glenbrook Rd
- 71 Burnham Rd
- 26 Meslar Rd
- 17 Jardine Ct
- 97 Burnham Rd
- 16 Sherman Ave
- 25 Glenbrook Rd
- 20 Kennedy Rd
- 35 Monett Ct
- 10 Veterans Way Unit 241
- 10 Doherty Way
- 69 Veterans Way
- 17 Veterans Way
- 11 Veterans Way Unit 123
- 144 Lake Rd
- 22 Walt Whitman Trail