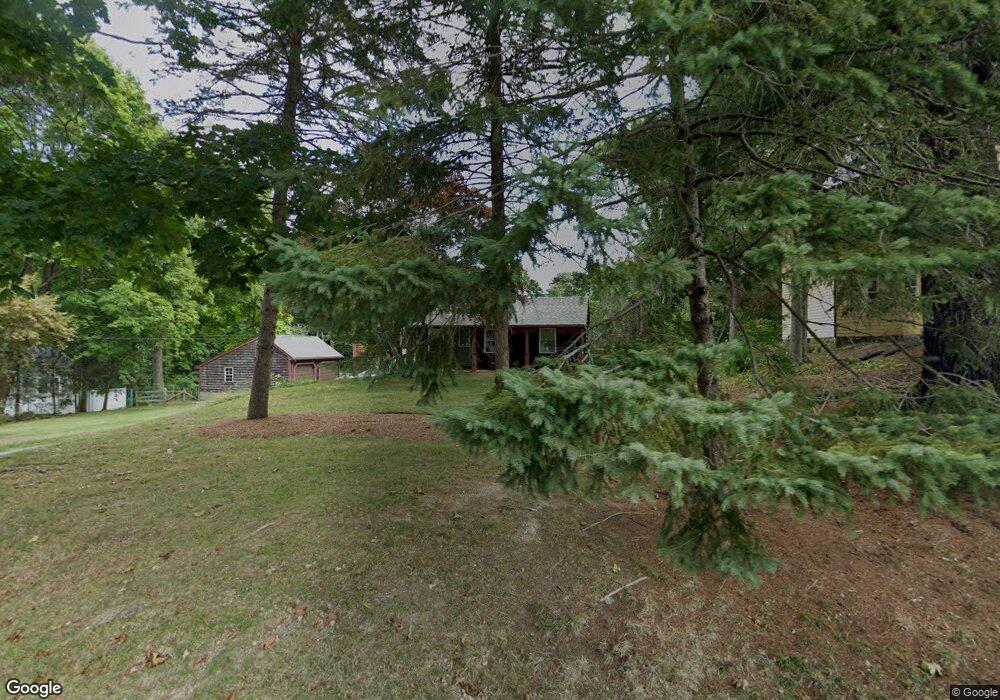
82 Messinger St Canton, MA 02021
Estimated Value: $660,000 - $759,000
2
Beds
2
Baths
1,832
Sq Ft
$381/Sq Ft
Est. Value
About This Home
This home is located at 82 Messinger St, Canton, MA 02021 and is currently estimated at $698,277, approximately $381 per square foot. 82 Messinger St is a home located in Norfolk County with nearby schools including Canton High School, St. John the Evangelist School, and Chabad Day School of School.
Ownership History
Date
Name
Owned For
Owner Type
Purchase Details
Closed on
Aug 17, 2018
Sold by
Morton John and Morton Linda A
Bought by
Cox James
Current Estimated Value
Home Financials for this Owner
Home Financials are based on the most recent Mortgage that was taken out on this home.
Original Mortgage
$439,650
Outstanding Balance
$376,998
Interest Rate
4.5%
Mortgage Type
New Conventional
Estimated Equity
$321,279
Purchase Details
Closed on
Dec 16, 2015
Sold by
Kessler Helen
Bought by
Morton John and Morton Linda A
Home Financials for this Owner
Home Financials are based on the most recent Mortgage that was taken out on this home.
Original Mortgage
$183,750
Interest Rate
3.89%
Mortgage Type
New Conventional
Purchase Details
Closed on
Aug 30, 1996
Sold by
Denny Angeline
Bought by
Pritchard Jean
Home Financials for this Owner
Home Financials are based on the most recent Mortgage that was taken out on this home.
Original Mortgage
$110,000
Interest Rate
8.18%
Mortgage Type
Purchase Money Mortgage
Create a Home Valuation Report for This Property
The Home Valuation Report is an in-depth analysis detailing your home's value as well as a comparison with similar homes in the area
Home Values in the Area
Average Home Value in this Area
Purchase History
| Date | Buyer | Sale Price | Title Company |
|---|---|---|---|
| Cox James | $488,500 | -- | |
| Morton John | $245,000 | -- | |
| Kessler Helen | -- | -- | |
| Pritchard Jean | $137,500 | -- | |
| Pritchard Jean F | $137,500 | -- |
Source: Public Records
Mortgage History
| Date | Status | Borrower | Loan Amount |
|---|---|---|---|
| Open | Cox James | $439,650 | |
| Previous Owner | Morton John | $183,750 | |
| Previous Owner | Pritchard Jean F | $110,000 |
Source: Public Records
Tax History
| Year | Tax Paid | Tax Assessment Tax Assessment Total Assessment is a certain percentage of the fair market value that is determined by local assessors to be the total taxable value of land and additions on the property. | Land | Improvement |
|---|---|---|---|---|
| 2025 | $5,410 | $547,000 | $311,100 | $235,900 |
| 2024 | $5,245 | $526,100 | $299,200 | $226,900 |
| 2023 | $5,228 | $494,600 | $299,200 | $195,400 |
| 2022 | $5,120 | $451,100 | $284,900 | $166,200 |
| 2021 | $5,013 | $410,900 | $259,000 | $151,900 |
| 2020 | $4,797 | $392,200 | $246,700 | $145,500 |
| 2019 | $4,500 | $362,900 | $224,200 | $138,700 |
| 2018 | $4,342 | $349,600 | $215,600 | $134,000 |
| 2017 | $4,388 | $343,100 | $211,400 | $131,700 |
| 2016 | $4,135 | $323,300 | $206,200 | $117,100 |
| 2015 | $4,009 | $312,700 | $200,200 | $112,500 |
Source: Public Records
Map
Nearby Homes
- 8 Walnut Knolls
- 80 Walnut St Unit 403
- 80 Walnut St Unit 311
- 424 Washington St
- 20 Sapphire Cir Unit Lot 2
- 20 Dunbar St
- 3 Revere Ct
- 81 Neponset St Unit 81
- 77 Neponset St Unit 77
- 87 Neponset St Unit 87
- 4 Forge Pond Unit D
- 24 Forge Pond Unit H
- 651 Washington St
- 1 Centre St Unit 11
- 60 Coppersmith Way Unit 304
- 15 Revolution Way Unit 2205
- 55 Brian Dr Unit G
- 36 Jessica Dr Unit H
- 1 Revolution Way Unit 307
- 85 Rosewood Dr Unit 28-1
- 68 Messinger St
- 88 Messinger St
- 13 Walnut Knolls
- 62 Messinger St
- 15 Walnut Knolls
- 77 Messinger St Unit 79
- 77 Messinger St
- 79 Messinger St
- 79 Messinger St Unit 79
- 56 Messinger St
- 87 Messinger St
- 104 Messinger St
- 17 Walnut Knolls
- 95 Messinger St
- 54 Messinger St
- 90 Messinger St Unit 1
- 90 Messinger St Unit 90
- 11 Walnut Knolls
- 12 Walnut Knolls
- 44 Messinger St Unit 44
Your Personal Tour Guide
Ask me questions while you tour the home.