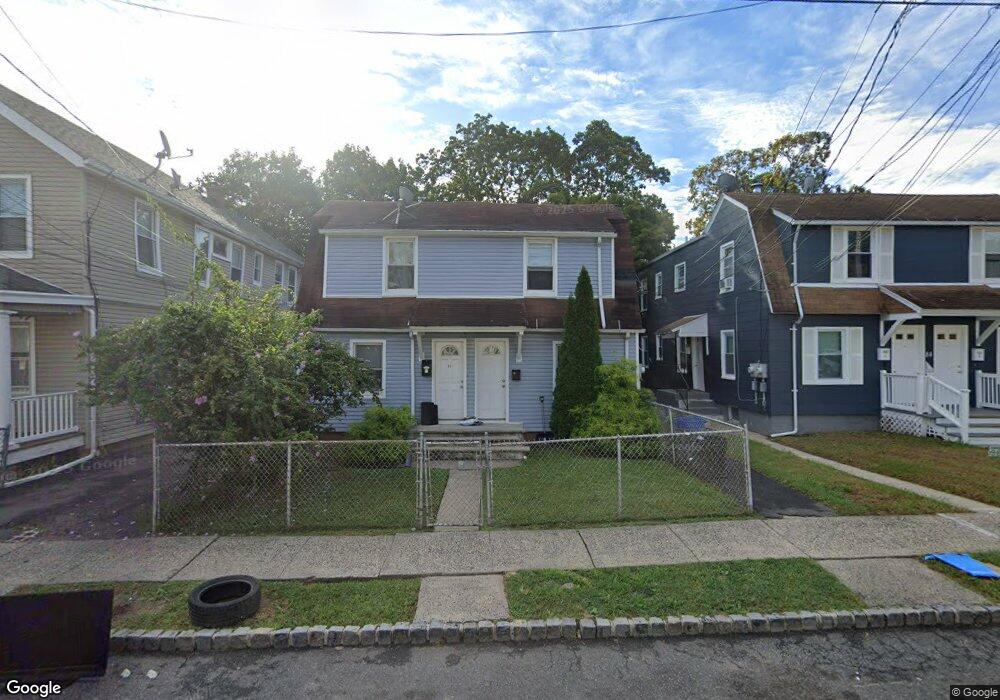
82 Mission St Unit 1L Montclair, NJ 07042
Estimated Value: $886,000 - $951,000
1
Bed
1
Bath
2,240
Sq Ft
$415/Sq Ft
Est. Value
About This Home
This home is located at 82 Mission St Unit 1L, Montclair, NJ 07042 and is currently estimated at $930,252, approximately $415 per square foot. 82 Mission St Unit 1L is a home located in Essex County with nearby schools including Hillside School, Bradford School, and Charles H. Bullock School.
Ownership History
Date
Name
Owned For
Owner Type
Purchase Details
Closed on
Aug 11, 2022
Sold by
Rabinovitch Elena and Rabinovitch Mark
Bought by
Rabinovitch Mark
Current Estimated Value
Purchase Details
Closed on
Apr 22, 2022
Sold by
Elena Rabinovitch
Bought by
Rabinovitch Elena and Rabinovitch Mark
Purchase Details
Closed on
Jan 10, 2022
Sold by
Unknown
Bought by
Rabinovitch Elena
Home Financials for this Owner
Home Financials are based on the most recent Mortgage that was taken out on this home.
Original Mortgage
$363,039
Interest Rate
3.56%
Mortgage Type
FHA
Purchase Details
Closed on
Aug 27, 2001
Sold by
Stettler David
Bought by
Bagunywa Peter
Home Financials for this Owner
Home Financials are based on the most recent Mortgage that was taken out on this home.
Original Mortgage
$182,141
Interest Rate
6.91%
Mortgage Type
FHA
Purchase Details
Closed on
Apr 19, 1991
Sold by
Stettlr David B Et Als
Bought by
Stettler David Be Et Ls
Create a Home Valuation Report for This Property
The Home Valuation Report is an in-depth analysis detailing your home's value as well as a comparison with similar homes in the area
Home Values in the Area
Average Home Value in this Area
Purchase History
| Date | Buyer | Sale Price | Title Company |
|---|---|---|---|
| Rabinovitch Mark | -- | None Listed On Document | |
| Rabinovitch Elena | -- | First American Title | |
| Rabinovitch Elena | $665,000 | Town Title | |
| Bagunywa Peter | $185,000 | -- | |
| Stettler David Be Et Ls | $189,100 | -- |
Source: Public Records
Mortgage History
| Date | Status | Borrower | Loan Amount |
|---|---|---|---|
| Previous Owner | Rabinovitch Elena | $363,039 | |
| Previous Owner | Bagunywa Peter | $182,141 |
Source: Public Records
Tax History Compared to Growth
Tax History
| Year | Tax Paid | Tax Assessment Tax Assessment Total Assessment is a certain percentage of the fair market value that is determined by local assessors to be the total taxable value of land and additions on the property. | Land | Improvement |
|---|---|---|---|---|
| 2025 | $16,454 | $486,800 | $122,100 | $364,700 |
| 2024 | $16,454 | $486,800 | $122,100 | $364,700 |
| 2023 | $12,037 | $486,800 | $122,100 | $364,700 |
| 2022 | $12,037 | $366,100 | $122,100 | $244,000 |
| 2021 | $11,829 | $366,100 | $122,100 | $244,000 |
| 2020 | $11,638 | $366,100 | $122,100 | $244,000 |
| 2019 | $11,014 | $350,100 | $122,100 | $228,000 |
| 2018 | $10,832 | $350,100 | $122,100 | $228,000 |
| 2017 | $11,938 | $319,700 | $82,100 | $237,600 |
| 2016 | $11,618 | $319,700 | $82,100 | $237,600 |
| 2015 | $11,273 | $319,700 | $82,100 | $237,600 |
| 2014 | $10,895 | $319,700 | $82,100 | $237,600 |
Source: Public Records
Map
Nearby Homes
- 81 Mission St Unit 2
- 81 Mission St
- 35 Wheeler St
- 20 Monroe Place
- 89 Elm St
- 12 Irving St
- 971 Bloomfield Ave
- 926 Bloomfield Ave Unit 4m
- 926 Bloomfield Ave
- 72 Glen Ridge Ave
- 24 Elm St Unit 2
- 261 Orange Rd
- 23 Prospect Terrace
- 50 Pine St Unit 214
- 96 Gates Ave
- 48 S Willow St Unit 2
- 50 Hamilton Rd
- 80 Bay St Unit 8
- 27 Grant St
- 5 Roosevelt Place
- 82 Mission St
- 82 Mission St Unit 2R
- 82 Mission St Unit 1R
- 82 Mission St Unit L2
- 82 Mission St Unit R1
- 82 Mission St Unit L1
- 80 Mission St
- 80 Mission St Unit 1
- 80 Mission St Unit 2
- 84 Mission St
- 78 Mission St
- 76 Mission St Unit 1
- 76 Mission St Unit 2
- 60 Maple Ave
- 60 Maple Ave Unit 1
- 60 Maple Ave Unit 2
- 58 Maple Ave Unit 1
- 58 Maple Ave
- 62 Maple Ave
- 66 Maple Ave