Estimated Value: $534,000 - $591,943
--
Bed
--
Bath
1,938
Sq Ft
$289/Sq Ft
Est. Value
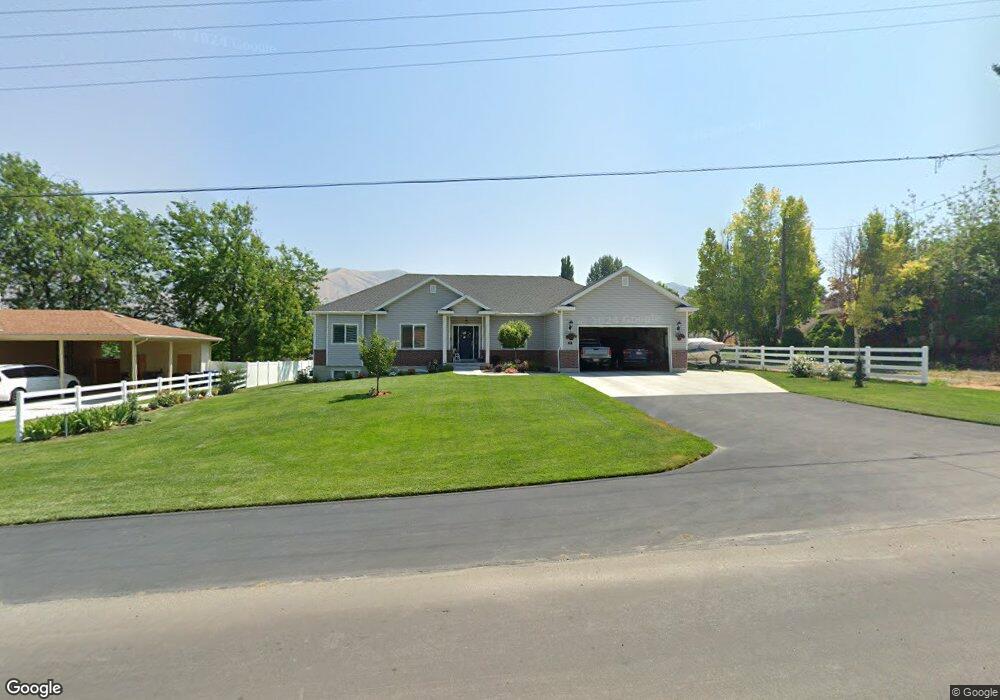
About This Home
This home is located at 82 N 100 E, Hyrum, UT 84319 and is currently estimated at $559,236, approximately $288 per square foot. 82 N 100 E is a home with nearby schools including Lincoln School, South Cache Middle School, and Mountain Crest High School.
Ownership History
Date
Name
Owned For
Owner Type
Purchase Details
Closed on
Aug 14, 2020
Sold by
Nelsen Jared
Bought by
Kartchner David and Kartchner Sharie
Current Estimated Value
Purchase Details
Closed on
Nov 14, 2011
Sold by
R & M Buck Property Llc
Bought by
Nielsen Jared
Home Financials for this Owner
Home Financials are based on the most recent Mortgage that was taken out on this home.
Original Mortgage
$180,000
Interest Rate
10%
Mortgage Type
Seller Take Back
Purchase Details
Closed on
Jun 3, 2010
Sold by
Buck Sherman Rulon and Voth Kathleen B
Bought by
R & M Buck Property Llc
Purchase Details
Closed on
May 21, 2010
Sold by
Buck Sherman Rulon and Voth Kathleen B
Bought by
R & M Buck Property Llc
Purchase Details
Closed on
Apr 1, 2010
Sold by
Memberst Trust Company Fsb
Bought by
Buck Sherman Rulon and Voth Kathleen B
Create a Home Valuation Report for This Property
The Home Valuation Report is an in-depth analysis detailing your home's value as well as a comparison with similar homes in the area
Home Values in the Area
Average Home Value in this Area
Purchase History
| Date | Buyer | Sale Price | Title Company |
|---|---|---|---|
| Kartchner David | -- | American Secure Title Logan | |
| Nielsen Jared | -- | Accommodation | |
| R & M Buck Property Llc | -- | Hickman Land Title Company | |
| R & M Buck Property Llc | -- | Hickman Land Title Company | |
| Buck Sherman Rulon | -- | None Available |
Source: Public Records
Mortgage History
| Date | Status | Borrower | Loan Amount |
|---|---|---|---|
| Previous Owner | Nielsen Jared | $180,000 |
Source: Public Records
Tax History Compared to Growth
Tax History
| Year | Tax Paid | Tax Assessment Tax Assessment Total Assessment is a certain percentage of the fair market value that is determined by local assessors to be the total taxable value of land and additions on the property. | Land | Improvement |
|---|---|---|---|---|
| 2025 | $2,238 | $321,255 | $0 | $0 |
| 2024 | $2,381 | $319,310 | $0 | $0 |
| 2023 | $2,007 | $257,290 | $0 | $0 |
| 2022 | $2,094 | $257,290 | $0 | $0 |
| 2021 | $1,370 | $259,300 | $66,200 | $193,100 |
| 2020 | $678 | $66,200 | $66,200 | $0 |
| 2019 | $456 | $41,900 | $41,900 | $0 |
| 2018 | $472 | $41,900 | $41,900 | $0 |
| 2017 | $500 | $41,900 | $0 | $0 |
| 2016 | $511 | $41,900 | $0 | $0 |
| 2015 | $513 | $41,900 | $0 | $0 |
| 2014 | $467 | $39,030 | $0 | $0 |
| 2013 | -- | $39,030 | $0 | $0 |
Source: Public Records
Map
Nearby Homes