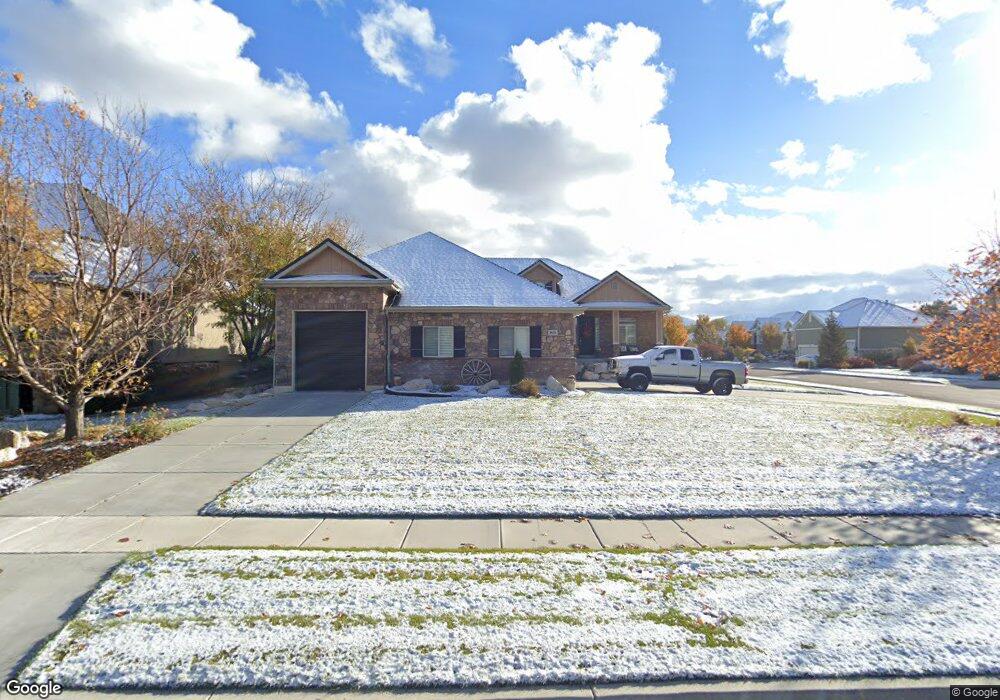
82 N 3050 W Layton, UT 84041
Estimated Value: $976,000 - $1,119,000
4
Beds
3
Baths
5,496
Sq Ft
$191/Sq Ft
Est. Value
About This Home
This home is located at 82 N 3050 W, Layton, UT 84041 and is currently estimated at $1,048,569, approximately $190 per square foot. 82 N 3050 W is a home located in Davis County with nearby schools including Sand Springs Elementary School, Legacy Junior High School, and Layton High School.
Ownership History
Date
Name
Owned For
Owner Type
Purchase Details
Closed on
Jan 7, 2022
Sold by
Giles Lynn K and Giles Pearl
Bought by
Giles Lynn K and Giles Pearl U
Current Estimated Value
Purchase Details
Closed on
Jun 16, 2016
Sold by
Giles Lynn and Giles Pearl
Bought by
Giles Lynn K and Giles Pearl
Purchase Details
Closed on
Mar 9, 2009
Sold by
Romer Gary H
Bought by
Romer Gary H and Romer Annette F
Home Financials for this Owner
Home Financials are based on the most recent Mortgage that was taken out on this home.
Original Mortgage
$323,700
Interest Rate
5.03%
Mortgage Type
New Conventional
Purchase Details
Closed on
Nov 20, 2003
Sold by
Mountain Green Development Llc
Bought by
Romer Gary H and Romer Annette F
Create a Home Valuation Report for This Property
The Home Valuation Report is an in-depth analysis detailing your home's value as well as a comparison with similar homes in the area
Home Values in the Area
Average Home Value in this Area
Purchase History
| Date | Buyer | Sale Price | Title Company |
|---|---|---|---|
| Giles Lynn K | -- | None Available | |
| Giles Lynn K | -- | Meridian Title Company | |
| Romer Gary H | -- | Hickman Land Title Co | |
| Romer Gary H | -- | Hickman Land Title Co | |
| Romer Gary H | -- | Bonneville Title Company Inc |
Source: Public Records
Mortgage History
| Date | Status | Borrower | Loan Amount |
|---|---|---|---|
| Previous Owner | Romer Gary H | $323,700 |
Source: Public Records
Tax History Compared to Growth
Tax History
| Year | Tax Paid | Tax Assessment Tax Assessment Total Assessment is a certain percentage of the fair market value that is determined by local assessors to be the total taxable value of land and additions on the property. | Land | Improvement |
|---|---|---|---|---|
| 2025 | $5,622 | $590,150 | $137,827 | $452,323 |
| 2024 | $5,550 | $586,850 | $144,970 | $441,880 |
| 2023 | $5,043 | $940,000 | $158,842 | $781,158 |
| 2022 | $4,923 | $498,300 | $88,993 | $409,307 |
| 2021 | $4,405 | $665,000 | $133,443 | $531,557 |
| 2020 | $4,109 | $595,000 | $114,970 | $480,030 |
| 2019 | $3,998 | $567,000 | $111,321 | $455,679 |
| 2018 | $3,736 | $532,000 | $98,357 | $433,643 |
| 2016 | $3,546 | $260,480 | $42,088 | $218,392 |
| 2015 | $3,115 | $217,195 | $42,088 | $175,107 |
| 2014 | $2,647 | $188,714 | $42,088 | $146,626 |
| 2013 | -- | $215,159 | $42,721 | $172,438 |
Source: Public Records
Map
Nearby Homes
- 2794 W Gentile St
- 245 S Summer Breeze Ln
- 101 S 3600 W
- 3535 W Overlook Dr
- 454 N 3550 W
- 3583 W 200 S
- 697 N 3275 W
- 306 S Sunburst Dr
- 567 W 3575 S
- 2875 N Hill Rd Unit 199
- 2875 N Hill Rd Unit 27
- 3169 S 550 W
- 818 N 2625 W
- 2184 W Gentile St
- 3263 W 850 N
- 2674 S 75 E
- 2681 S 200 E
- 162 E 2600 S
- 2601 S 200 E
- 2631 W 1075 N