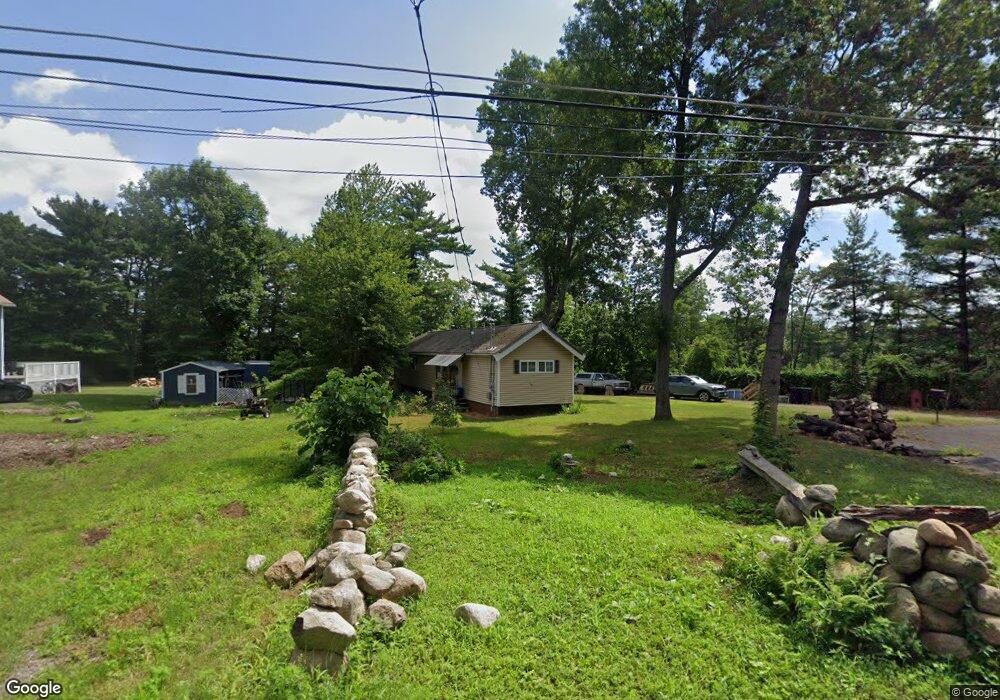
82 N High St Foxboro, MA 02035
Estimated Value: $362,000 - $504,000
2
Beds
1
Bath
975
Sq Ft
$454/Sq Ft
Est. Value
About This Home
This home is located at 82 N High St, Foxboro, MA 02035 and is currently estimated at $442,228, approximately $453 per square foot. 82 N High St is a home with nearby schools including Foxborough High School, Foxborough Regional Charter School, and Hands-On-Montessori School.
Ownership History
Date
Name
Owned For
Owner Type
Purchase Details
Closed on
Nov 20, 2002
Sold by
Lindquist Harold C
Bought by
Lindquist Michael W
Current Estimated Value
Home Financials for this Owner
Home Financials are based on the most recent Mortgage that was taken out on this home.
Original Mortgage
$60,000
Outstanding Balance
$25,224
Interest Rate
6.07%
Mortgage Type
Purchase Money Mortgage
Estimated Equity
$417,004
Create a Home Valuation Report for This Property
The Home Valuation Report is an in-depth analysis detailing your home's value as well as a comparison with similar homes in the area
Home Values in the Area
Average Home Value in this Area
Purchase History
| Date | Buyer | Sale Price | Title Company |
|---|---|---|---|
| Lindquist Michael W | $60,000 | -- |
Source: Public Records
Mortgage History
| Date | Status | Borrower | Loan Amount |
|---|---|---|---|
| Open | Lindquist Michael W | $60,000 |
Source: Public Records
Tax History Compared to Growth
Tax History
| Year | Tax Paid | Tax Assessment Tax Assessment Total Assessment is a certain percentage of the fair market value that is determined by local assessors to be the total taxable value of land and additions on the property. | Land | Improvement |
|---|---|---|---|---|
| 2025 | $4,372 | $330,700 | $172,900 | $157,800 |
| 2024 | $3,698 | $273,700 | $172,900 | $100,800 |
| 2023 | $3,500 | $246,300 | $164,700 | $81,600 |
| 2022 | $3,536 | $243,500 | $157,500 | $86,000 |
| 2021 | $3,345 | $226,900 | $143,200 | $83,700 |
| 2020 | $3,205 | $220,000 | $143,200 | $76,800 |
| 2019 | $3,088 | $210,100 | $136,400 | $73,700 |
| 2018 | $3,016 | $207,000 | $136,400 | $70,600 |
| 2017 | $2,886 | $191,900 | $127,500 | $64,400 |
| 2016 | $3,010 | $203,100 | $137,100 | $66,000 |
| 2015 | $2,784 | $183,300 | $115,800 | $67,500 |
| 2014 | $1,839 | $122,700 | $113,500 | $9,200 |
Source: Public Records
Map
Nearby Homes
- 356 Central St
- 12 Spring St
- 450 West St
- 166 Chauncy St
- 11 W Belcher Rd Unit 2
- 28 Angell St
- 42 Angell St
- 44 Angell St Unit 44
- 80 Mill St
- 619 N Main St
- 406 South St
- 18 Winter St Unit E
- 22 Pleasant St Unit C
- 14 Winter St Unit B
- 84 Cocasset St Unit A6
- 82 Brook St
- 24 Mechanic St
- 28 Court St
- 14 Baker St
- 11 Orchard Place Unit 11