Estimated Value: $215,000 - $249,440
3
Beds
2
Baths
1,700
Sq Ft
$140/Sq Ft
Est. Value
About This Home
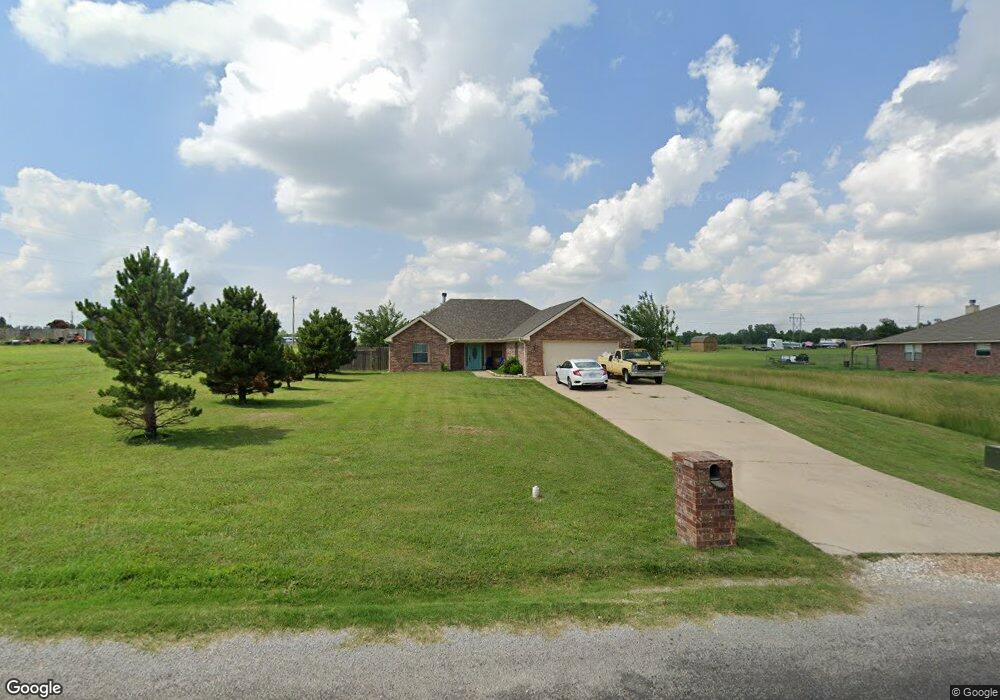
This home is located at 82 NE Uvon Ln, Elgin, OK 73538 and is currently estimated at $238,360, approximately $140 per square foot. 82 NE Uvon Ln is a home located in Comanche County with nearby schools including Elgin Elementary School, Elgin Middle School, and Elgin High School.
Ownership History
Date
Name
Owned For
Owner Type
Purchase Details
Closed on
Jun 29, 2018
Sold by
Martinez Anthony N and Martinez Sebrina A
Bought by
Persons Haward R and Persons Tim Hynnun
Current Estimated Value
Home Financials for this Owner
Home Financials are based on the most recent Mortgage that was taken out on this home.
Original Mortgage
$173,655
Outstanding Balance
$150,498
Interest Rate
4.5%
Mortgage Type
VA
Estimated Equity
$87,862
Purchase Details
Closed on
Jan 19, 2006
Sold by
Martinez Anthony N
Bought by
Martinez Anthony N and Martinez Sebrina A
Home Financials for this Owner
Home Financials are based on the most recent Mortgage that was taken out on this home.
Original Mortgage
$152,900
Interest Rate
6.25%
Mortgage Type
New Conventional
Purchase Details
Closed on
Jan 18, 2006
Sold by
Mcdonald Debra S and Mcdonald James
Bought by
Martinez Anthony N
Home Financials for this Owner
Home Financials are based on the most recent Mortgage that was taken out on this home.
Original Mortgage
$152,900
Interest Rate
6.25%
Mortgage Type
New Conventional
Create a Home Valuation Report for This Property
The Home Valuation Report is an in-depth analysis detailing your home's value as well as a comparison with similar homes in the area
Home Values in the Area
Average Home Value in this Area
Purchase History
| Date | Buyer | Sale Price | Title Company |
|---|---|---|---|
| Persons Haward R | $170,000 | None Available | |
| Martinez Anthony N | -- | -- | |
| Martinez Anthony N | $155,000 | -- |
Source: Public Records
Mortgage History
| Date | Status | Borrower | Loan Amount |
|---|---|---|---|
| Open | Persons Haward R | $173,655 | |
| Previous Owner | Martinez Anthony N | $152,900 |
Source: Public Records
Tax History Compared to Growth
Tax History
| Year | Tax Paid | Tax Assessment Tax Assessment Total Assessment is a certain percentage of the fair market value that is determined by local assessors to be the total taxable value of land and additions on the property. | Land | Improvement |
|---|---|---|---|---|
| 2024 | $2,179 | $21,770 | $3,226 | $18,544 |
| 2023 | $2,179 | $19,746 | $3,094 | $16,652 |
| 2022 | $1,972 | $18,806 | $3,094 | $15,712 |
| 2021 | $1,950 | $18,264 | $3,094 | $15,170 |
| 2020 | $1,872 | $18,608 | $3,094 | $15,514 |
| 2019 | $2,049 | $18,782 | $3,094 | $15,688 |
| 2018 | $1,973 | $19,131 | $3,094 | $16,037 |
| 2017 | $1,855 | $18,819 | $2,788 | $16,031 |
| 2016 | $1,782 | $18,270 | $2,250 | $16,020 |
| 2015 | $1,780 | $18,301 | $539 | $17,762 |
| 2014 | $1,743 | $18,301 | $539 | $17,762 |
Source: Public Records
Map
Nearby Homes
- 304 Crestview Dr
- 106 Belle Cir
- 326 NE Uvon Ln
- 1225 Pebble Trail
- 12410 Big Horn Ln
- 1405 Limestone Way
- 1414 Limestone Way
- 704 6th St
- 611 7th St
- 1210 2nd Place
- 519 G St
- 102 K St
- 89 NE Deerfield Dr
- 5499 NE Elk Point Rd
- 508 2nd St
- 13427 NE Kleeman Rd
- 13453 NE Kleeman Rd
- 203 3rd St
- 11225 NE Marigold Ln
- 13707 NE Kleeman Rd
- 81 NE Uvon Ln
- 108 NE Uvon Ln
- 107 NE Uvon Ln
- 126 NE Uvon Ln
- 65 NE Uvon Ln
- 13128 NE Keeney Rd
- 129 NE Uvon
- 125 NE Uvon Ln
- 144 NE Uvon Ln
- 13070 NE Keeney Rd
- 13104 NE Keeney Rd
- 143 NE Uvon Ln
- 13040 NE Keeney Rd
- 163 NE Uvon Ln
- 13139 NE Keeney Rd
- 162 NE Uvon Ln
- 13095 NE Keeney Rd
- 13063 NE Keeney Rd
- 181 NE Uvon Ln
- 13115 NE Keeney Rd