Estimated Value: $310,458 - $346,000
4
Beds
3
Baths
2,077
Sq Ft
$155/Sq Ft
Est. Value
About This Home
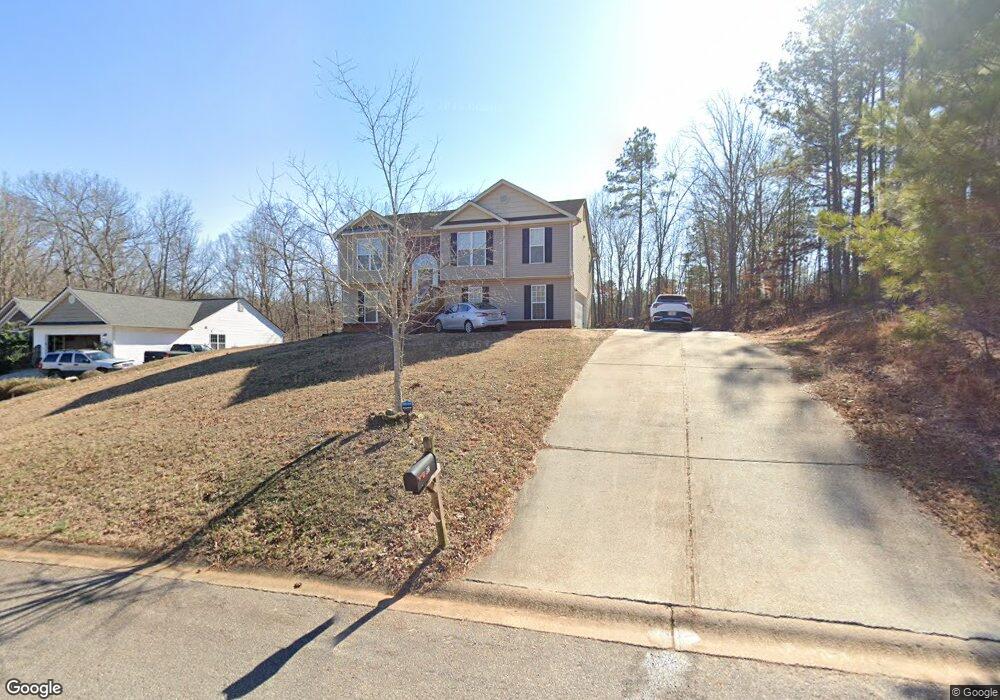
This home is located at 82 Oakview Dr, Hull, GA 30646 and is currently estimated at $322,115, approximately $155 per square foot. 82 Oakview Dr is a home located in Madison County with nearby schools including Madison County High School.
Ownership History
Date
Name
Owned For
Owner Type
Purchase Details
Closed on
May 15, 2025
Sold by
Williams-Ramire Christy R
Bought by
Edmondson Christy Williams Trust
Current Estimated Value
Purchase Details
Closed on
Jan 12, 2023
Sold by
Williams Ramirez Christy R
Bought by
Menefield Franklin and Menefield Priscilla A
Purchase Details
Closed on
Aug 18, 2011
Sold by
Secretary Of Housing & Urban Development
Bought by
Williams Ramirez Christy R
Home Financials for this Owner
Home Financials are based on the most recent Mortgage that was taken out on this home.
Original Mortgage
$99,740
Interest Rate
4.53%
Mortgage Type
New Conventional
Purchase Details
Closed on
Apr 6, 2010
Sold by
Bank Of America Na
Bought by
Secretary Of Housing & Urban Development
Purchase Details
Closed on
Jan 14, 2008
Sold by
Bradford Dwyane
Bought by
Bradford Dwayne
Home Financials for this Owner
Home Financials are based on the most recent Mortgage that was taken out on this home.
Original Mortgage
$164,419
Interest Rate
6.06%
Mortgage Type
New Conventional
Create a Home Valuation Report for This Property
The Home Valuation Report is an in-depth analysis detailing your home's value as well as a comparison with similar homes in the area
Purchase History
| Date | Buyer | Sale Price | Title Company |
|---|---|---|---|
| Edmondson Christy Williams Trust | -- | -- | |
| Menefield Franklin | $4,500 | -- | |
| Williams Ramirez Christy R | $87,000 | -- | |
| Secretary Of Housing & Urban Development | $184,550 | -- | |
| Bank Of America Na | $184,550 | -- | |
| Bradford Dwayne | -- | -- | |
| Bradford Dwayne | $167,000 | -- |
Source: Public Records
Mortgage History
| Date | Status | Borrower | Loan Amount |
|---|---|---|---|
| Previous Owner | Williams Ramirez Christy R | $99,740 | |
| Previous Owner | Bradford Dwayne | $164,419 |
Source: Public Records
Tax History
| Year | Tax Paid | Tax Assessment Tax Assessment Total Assessment is a certain percentage of the fair market value that is determined by local assessors to be the total taxable value of land and additions on the property. | Land | Improvement |
|---|---|---|---|---|
| 2025 | $1,983 | $80,048 | $12,600 | $67,448 |
| 2024 | $1,981 | $78,110 | $12,600 | $65,510 |
| 2023 | $1,412 | $74,234 | $12,600 | $61,634 |
| 2022 | $1,857 | $67,323 | $12,600 | $54,723 |
| 2021 | $1,688 | $55,300 | $12,600 | $42,700 |
| 2020 | $1,700 | $55,300 | $12,600 | $42,700 |
| 2019 | $1,694 | $54,490 | $12,600 | $41,890 |
| 2018 | $1,657 | $53,124 | $12,600 | $40,524 |
| 2017 | $1,548 | $53,752 | $12,600 | $41,152 |
| 2016 | $1,542 | $53,718 | $12,600 | $41,118 |
| 2015 | $1,318 | $45,899 | $7,200 | $38,699 |
| 2014 | $1,337 | $46,264 | $7,200 | $39,064 |
| 2013 | -- | $46,264 | $7,200 | $39,064 |
Source: Public Records
Map
Nearby Homes
- 162 Oak View Dr
- 103 Three Rivers Ct
- 450 Candlestick Dr
- 149 Candlestick Dr
- 210 Joe Graham Rd
- 65 Kimberly Way
- 105 Watson Dr
- 259 Watson Dr
- 140 Kimberly Way
- 1080 Spratlin Mill Dr
- 31 Rolling Woods Ln
- 975 Diamond Hill Neese Rd
- 0 Reese Ln Unit 7703910
- 0 Reese Ln Unit CL346847
- 8986 Highway 29 S
- 73 Woodale St
- 284 Snow Farm Rd
- 0 Spratlin Mill Dr Unit LOT 14-C
- 789 Glenn Carrie Rd
- 1618 McCannon Morris Rd
- 82 Oak View Dr
- 82 Oak View Dr Unit LOT17
- 108 Oakview Dr
- 108 Oak View Dr Unit lot16
- 108 Oak View Dr
- 44 Oak View Dr
- 44 Oak View Dr Unit lot18
- 44 Oakview Dr
- 65 Oak View Dr
- 65 Oak View Dr Unit lot1
- 65 Oakview Dr
- 140 Oak View Dr
- 624 Garnett Ward Rd
- 137 Oak View Dr
- 137 Oakview Dr
- 140 Oakview Dr
- 162 Oak View Drive Lot13
- 162 Oakview Dr
- 144 Oakview Dr
- 558 Garnett Ward Rd
Your Personal Tour Guide
Ask me questions while you tour the home.