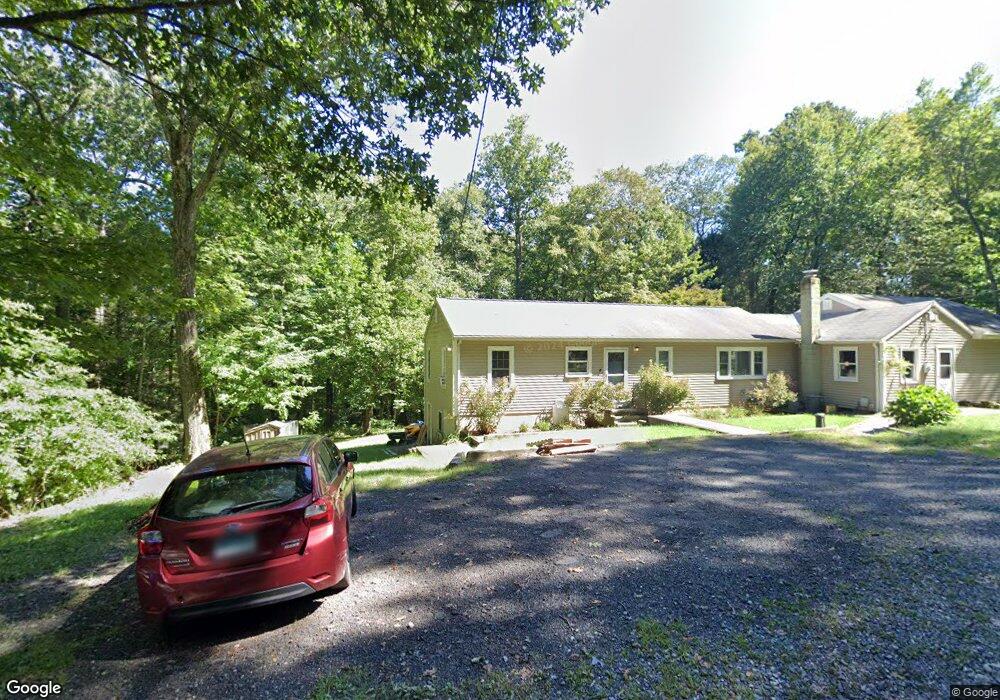
82 Pachaug Trail Monroe, CT 06468
Estimated Value: $506,000 - $591,000
2
Beds
1
Bath
750
Sq Ft
$735/Sq Ft
Est. Value
About This Home
This home is located at 82 Pachaug Trail, Monroe, CT 06468 and is currently estimated at $551,082, approximately $734 per square foot. 82 Pachaug Trail is a home located in Fairfield County with nearby schools including Fawn Hollow Elementary School, Jockey Hollow Middle School, and Masuk High School.
Ownership History
Date
Name
Owned For
Owner Type
Purchase Details
Closed on
Feb 1, 2016
Sold by
Fnma
Bought by
Mckee Andrew and Mckee Melissa
Current Estimated Value
Purchase Details
Closed on
Apr 1, 2015
Sold by
Green Tree Servicing L
Bought by
Fnma
Purchase Details
Closed on
Mar 16, 2015
Sold by
Petersen April
Bought by
Green Tree Servicing L
Purchase Details
Closed on
Apr 23, 2012
Sold by
Petersen April
Bought by
Zukowski Jeffrey
Purchase Details
Closed on
Aug 22, 2007
Sold by
White Mary Caroline
Bought by
Zukowski Jeffrey and Pereson April L
Home Financials for this Owner
Home Financials are based on the most recent Mortgage that was taken out on this home.
Original Mortgage
$332,405
Interest Rate
6.78%
Purchase Details
Closed on
Feb 15, 2002
Sold by
Starr Christopher K and Starr Donna F
Bought by
White Mary C
Create a Home Valuation Report for This Property
The Home Valuation Report is an in-depth analysis detailing your home's value as well as a comparison with similar homes in the area
Home Values in the Area
Average Home Value in this Area
Purchase History
| Date | Buyer | Sale Price | Title Company |
|---|---|---|---|
| Mckee Andrew | $149,625 | -- | |
| Mckee Andrew | $149,625 | -- | |
| Fnma | -- | -- | |
| Green Tree Servicing L | -- | -- | |
| Zukowski Jeffrey | -- | -- | |
| Zukowski Jeffrey | $349,900 | -- | |
| Zukowski Jeffrey | $349,900 | -- | |
| White Mary C | $280,000 | -- | |
| White Mary C | $280,000 | -- |
Source: Public Records
Mortgage History
| Date | Status | Borrower | Loan Amount |
|---|---|---|---|
| Previous Owner | White Mary C | $332,405 |
Source: Public Records
Tax History
| Year | Tax Paid | Tax Assessment Tax Assessment Total Assessment is a certain percentage of the fair market value that is determined by local assessors to be the total taxable value of land and additions on the property. | Land | Improvement |
|---|---|---|---|---|
| 2025 | $9,304 | $324,520 | $97,020 | $227,500 |
| 2024 | $7,390 | $193,100 | $70,400 | $122,700 |
| 2023 | $7,251 | $193,100 | $70,400 | $122,700 |
| 2022 | $7,118 | $193,100 | $70,400 | $122,700 |
| 2021 | $7,021 | $193,100 | $70,400 | $122,700 |
| 2020 | $6,851 | $193,100 | $70,400 | $122,700 |
| 2019 | $7,063 | $198,500 | $82,600 | $115,900 |
| 2018 | $6,995 | $198,500 | $82,600 | $115,900 |
| 2017 | $7,098 | $198,500 | $82,600 | $115,900 |
| 2016 | $6,948 | $198,500 | $82,600 | $115,900 |
| 2015 | $6,818 | $198,500 | $82,600 | $115,900 |
| 2014 | $7,170 | $231,210 | $104,160 | $127,050 |
Source: Public Records
Map
Nearby Homes
- 159 Freeman Rd
- 124 Bagburn Rd
- 34 Bagburn Rd
- 13 Jordan Hill Rd Unit Lot 4
- 15 Legacy Ln
- 24 Legacy Ln
- 13 Legacy Ln
- 567 Roosevelt Dr
- 8 Stone Bridge Trail
- 44 Old Country Rd
- 455 Barn Hill Rd
- 30 E Village Rd
- 3 Serenity Ln
- 238 Berkshire Rd
- 1161 Monroe Turnpike
- 39 Bradley Ln
- 1115 Monroe Turnpike
- 59 Great Ring Rd
- 1093 Monroe Turnpike
- 49 Great Ring Rd
- 80 Pachaug Trail
- 88 Pachaug Trail
- 70 Pachaug Trail
- 69 Pachaug Trail
- 94 Moosup Trail
- 101 Moosup Trail
- 62 Pachaug Trail
- 129 Cottage St
- 95 Moosup Trail
- 61 Pachaug Trail
- 88 Downs Rd
- 143 Cottage St
- 58 Pachaug Trail
- 56 Pachaug Trail
- 52 Pachaug Trail
- 87 Downs Rd
- 153 Cottage St
- 97 Downs Rd
- 80 Downs Rd
- 81 Downs Rd
Your Personal Tour Guide
Ask me questions while you tour the home.