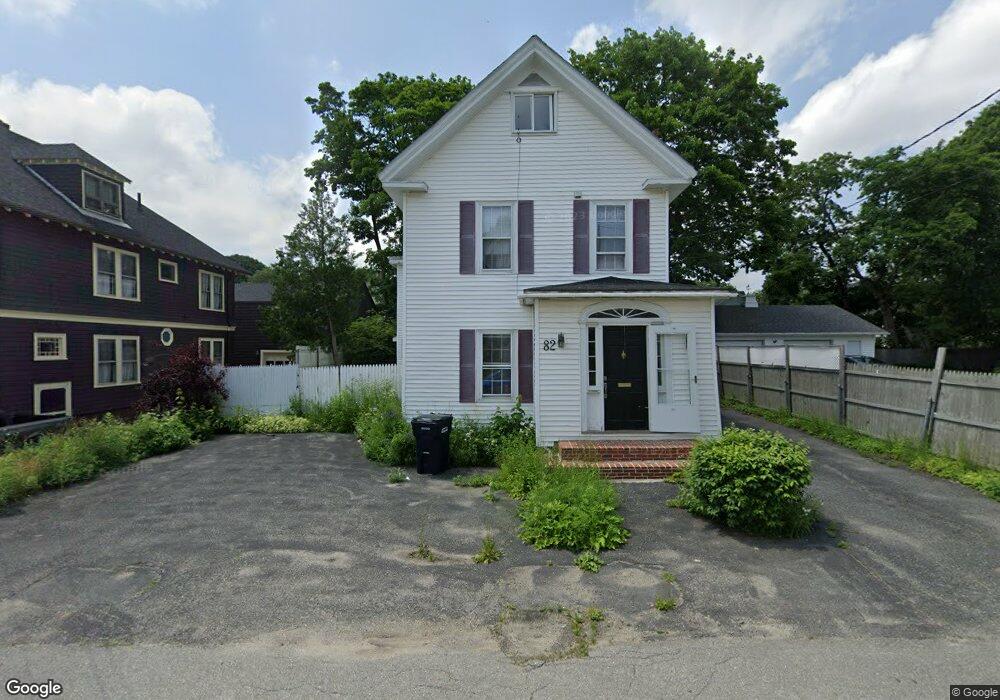
82 Palm St Bangor, ME 04401
Tree Streets NeighborhoodEstimated Value: $359,000 - $498,000
5
Beds
2
Baths
2,936
Sq Ft
$135/Sq Ft
Est. Value
About This Home
This home is located at 82 Palm St, Bangor, ME 04401 and is currently estimated at $397,585, approximately $135 per square foot. 82 Palm St is a home located in Penobscot County with nearby schools including Abraham Lincoln School, Mary Snow School, and William S. Cohen School.
Ownership History
Date
Name
Owned For
Owner Type
Purchase Details
Closed on
Sep 6, 2005
Sold by
Bridge Jeffrey and Kneeland Anthony
Bought by
Irwin Joel R and Pellon-Irwin Pamala S
Current Estimated Value
Home Financials for this Owner
Home Financials are based on the most recent Mortgage that was taken out on this home.
Original Mortgage
$195,106
Outstanding Balance
$104,120
Interest Rate
5.81%
Mortgage Type
Purchase Money Mortgage
Estimated Equity
$293,465
Purchase Details
Closed on
Jun 28, 2005
Sold by
Roberts Teresa L
Bought by
Kneeland Anthony C
Purchase Details
Closed on
Jun 23, 2005
Sold by
Colley Lucille J
Bought by
Bridge Jeffrey S
Create a Home Valuation Report for This Property
The Home Valuation Report is an in-depth analysis detailing your home's value as well as a comparison with similar homes in the area
Home Values in the Area
Average Home Value in this Area
Purchase History
| Date | Buyer | Sale Price | Title Company |
|---|---|---|---|
| Irwin Joel R | -- | -- | |
| Kneeland Anthony C | -- | -- | |
| Bridge Jeffrey S | -- | -- |
Source: Public Records
Mortgage History
| Date | Status | Borrower | Loan Amount |
|---|---|---|---|
| Open | Irwin Joel R | $195,106 |
Source: Public Records
Tax History Compared to Growth
Tax History
| Year | Tax Paid | Tax Assessment Tax Assessment Total Assessment is a certain percentage of the fair market value that is determined by local assessors to be the total taxable value of land and additions on the property. | Land | Improvement |
|---|---|---|---|---|
| 2024 | $5,558 | $299,600 | $20,100 | $279,500 |
| 2023 | $5,033 | $262,800 | $19,400 | $243,400 |
| 2022 | $4,663 | $228,600 | $19,400 | $209,200 |
| 2021 | $4,369 | $195,900 | $17,900 | $178,000 |
| 2020 | $4,364 | $188,100 | $17,600 | $170,500 |
| 2019 | $4,188 | $182,100 | $17,600 | $164,500 |
| 2018 | $4,087 | $178,100 | $17,600 | $160,500 |
| 2017 | $3,885 | $172,300 | $17,600 | $154,700 |
| 2016 | $3,794 | $168,600 | $17,600 | $151,000 |
| 2015 | $3,710 | $169,000 | $17,600 | $151,400 |
| 2014 | $3,630 | $166,500 | $17,600 | $148,900 |
| 2013 | $3,603 | $173,200 | $17,600 | $155,600 |
Source: Public Records
Map
Nearby Homes