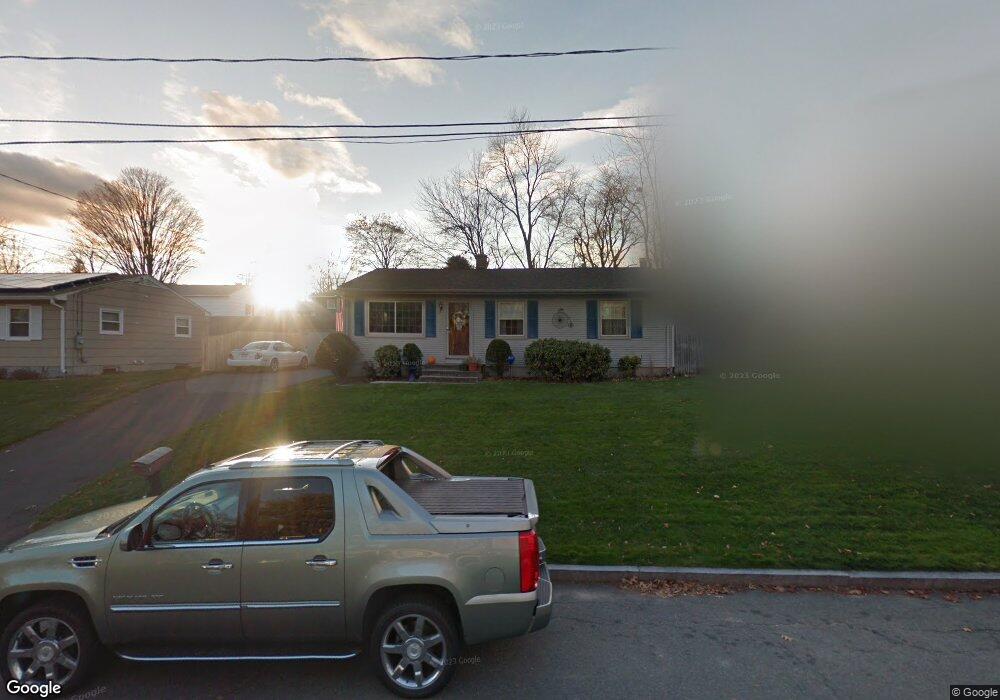
82 Pinecrest Dr Springfield, MA 01118
East Forest Park NeighborhoodEstimated Value: $283,000 - $304,000
3
Beds
1
Bath
1,053
Sq Ft
$281/Sq Ft
Est. Value
About This Home
This home is located at 82 Pinecrest Dr, Springfield, MA 01118 and is currently estimated at $296,037, approximately $281 per square foot. 82 Pinecrest Dr is a home located in Hampden County with nearby schools including Frederick Harris Elementary School, M Marcus Kiley Middle, and Springfield High School of Science and Technology.
Ownership History
Date
Name
Owned For
Owner Type
Purchase Details
Closed on
Feb 24, 2025
Sold by
Rodriguez Michael and Roman William
Bought by
Rodriguez Michael and Roman William
Current Estimated Value
Purchase Details
Closed on
Sep 17, 2024
Sold by
Flynn Marilyn Lois Est and Leas
Bought by
Rodriguez Michael and Roman William
Home Financials for this Owner
Home Financials are based on the most recent Mortgage that was taken out on this home.
Original Mortgage
$270,655
Interest Rate
6.73%
Mortgage Type
FHA
Purchase Details
Closed on
Jun 20, 2022
Sold by
Flynn Marilyn Lois Est and Leas
Bought by
Leas Catherine M
Purchase Details
Closed on
Apr 25, 1989
Sold by
Berard & Sons Inc
Bought by
Flynn John W
Home Financials for this Owner
Home Financials are based on the most recent Mortgage that was taken out on this home.
Original Mortgage
$89,900
Interest Rate
10.79%
Mortgage Type
Purchase Money Mortgage
Create a Home Valuation Report for This Property
The Home Valuation Report is an in-depth analysis detailing your home's value as well as a comparison with similar homes in the area
Home Values in the Area
Average Home Value in this Area
Purchase History
| Date | Buyer | Sale Price | Title Company |
|---|---|---|---|
| Rodriguez Michael | -- | None Available | |
| Rodriguez Michael | -- | None Available | |
| Rodriguez Michael | $280,000 | None Available | |
| Rodriguez Michael | $280,000 | None Available | |
| Rodriguez Michael | $280,000 | None Available | |
| Leas Catherine M | -- | None Available | |
| Leas Catherine M | -- | None Available | |
| Leas Catherine M | -- | None Available | |
| Flynn John W | $114,900 | -- | |
| Flynn John W | $114,900 | -- |
Source: Public Records
Mortgage History
| Date | Status | Borrower | Loan Amount |
|---|---|---|---|
| Previous Owner | Rodriguez Michael | $270,655 | |
| Previous Owner | Flynn John W | $92,500 | |
| Previous Owner | Flynn John W | $89,900 |
Source: Public Records
Tax History
| Year | Tax Paid | Tax Assessment Tax Assessment Total Assessment is a certain percentage of the fair market value that is determined by local assessors to be the total taxable value of land and additions on the property. | Land | Improvement |
|---|---|---|---|---|
| 2025 | $3,660 | $233,400 | $51,400 | $182,000 |
| 2024 | $3,695 | $230,100 | $51,400 | $178,700 |
| 2023 | $2,953 | $173,200 | $49,000 | $124,200 |
| 2022 | $3,192 | $169,600 | $49,000 | $120,600 |
| 2021 | $3,243 | $171,600 | $44,500 | $127,100 |
| 2020 | $3,027 | $155,000 | $44,500 | $110,500 |
| 2019 | $2,909 | $147,800 | $44,500 | $103,300 |
| 2018 | $2,789 | $141,700 | $44,500 | $97,200 |
| 2017 | $2,772 | $141,000 | $44,500 | $96,500 |
| 2016 | $2,422 | $123,200 | $44,500 | $78,700 |
| 2015 | $2,349 | $119,400 | $44,500 | $74,900 |
Source: Public Records
Map
Nearby Homes
- 101 Regal St
- 19 Manor Ct Unit 19
- 509 Plumtree Rd
- 55 Allen St
- 125 Manor Ct Unit 125
- 647 Plumtree Rd
- 37 Chesterfield Ave
- 47 Hartford Terrace
- 49 Corcoran Blvd
- 7 Ashbrook St
- 75 Gillette Cir
- 79 Roosevelt Ave
- 119 Powell Ave
- 17 Pebble Mill Rd
- 120 Bridle Path Rd
- 384 Abbott St
- 1088 Sumner Ave
- 13 Bither St
- 206 Treetop Ave
- 29 Eddywood St
- 74 Pinecrest Dr
- 90 Pinecrest Dr
- 81 Emerson St
- 93 Emerson St
- 81 Pinecrest Dr
- 66 Pinecrest Dr
- 73 Pinecrest Dr
- 71 Emerson St
- 65 Pinecrest Dr
- 60 Pinecrest Dr
- 103 Emerson St
- 86 Emerson St
- 101 Pinecrest Dr
- 80 Emerson St
- 61 Emerson St
- 96 Emerson St
- 110 Pinecrest Dr
- 70 Emerson St
- 52 Pinecrest Dr
- 111 Emerson St
Your Personal Tour Guide
Ask me questions while you tour the home.