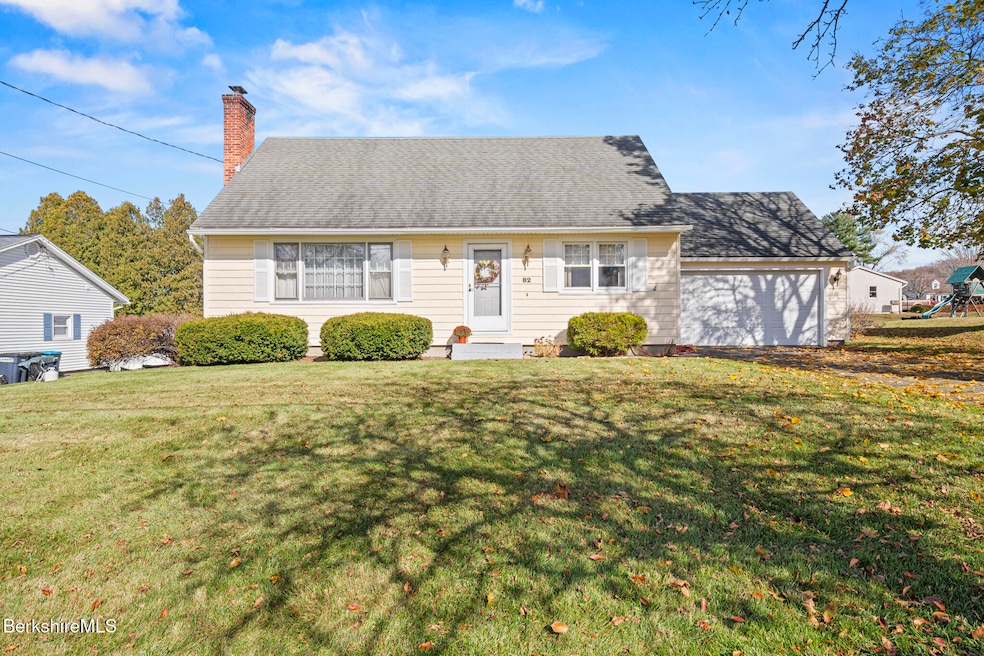
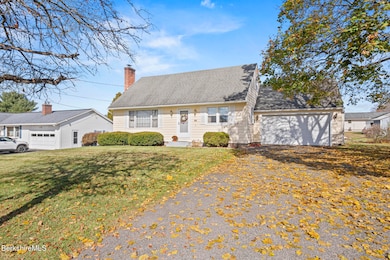
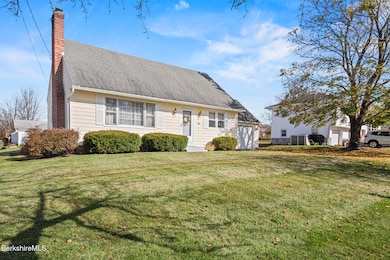

82 Quirico Dr Pittsfield, MA 01201
Estimated payment $2,436/month
Highlights
- Cape Cod Architecture
- Main Floor Bedroom
- 1 Car Attached Garage
- Wood Flooring
- Fireplace
- Landscaped
About This Home
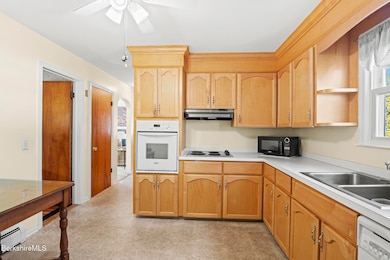
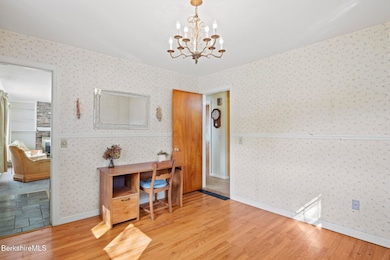
Home for the holidays. Well maintained, move in ready 3-bedroom, 2 bath cape home in a desirable southeast section of Pittsfield. Close to the Lenox border, Tanglewood, shopping centers, Bousquet Ski Area and Bousquet Sport. Gas heating system, living room fireplace, first floor bedroom and oversized garage. Wood floors throughout, finished basement room with room for a workshop. Well-kept yard with plenty of room for gardening. Located close to October Mt and Canoe Meadows for the outdoor enthusiast. Easy access to the center of Lenox, Pittsfield and routes in and out of the Berkshires. Don't miss this opportunity to be settled in for the New Year and start your resolutions with keys to your new home in your hand!

Open House Schedule
-
Saturday, November 29, 202510:30 am to 12:00 pm11/29/2025 10:30:00 AM +00:0011/29/2025 12:00:00 PM +00:00Add to Calendar
Home Details
Home Type
- Single Family
Est. Annual Taxes
- $5,283
Year Built
- 1962
Lot Details
- 0.26 Acre Lot
- Landscaped
Home Design
- Cape Cod Architecture
- Wood Frame Construction
- Asphalt Shingled Roof
- Vinyl Siding
Interior Spaces
- 1,826 Sq Ft Home
- Ceiling Fan
- Fireplace
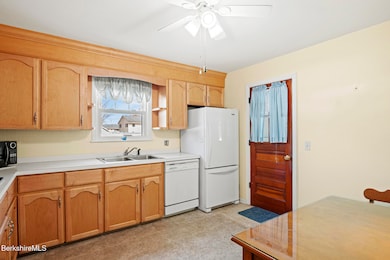
Kitchen
- Built-In Electric Oven
- Cooktop
- Dishwasher
Flooring
- Wood
- Carpet
- Ceramic Tile
Bedrooms and Bathrooms
- 3 Bedrooms
- Main Floor Bedroom
- 2 Full Bathrooms
Laundry
- Dryer
- Washer
Partially Finished Basement
- Basement Fills Entire Space Under The House
- Interior Basement Entry
Parking
- 1 Car Attached Garage
- Off-Street Parking
Outdoor Features
- Outbuilding
Schools
- Egremont Elementary School
- Theodore Herberg Middle School
- Pittsfield High School
Utilities
- Hot Water Heating System
- Heating System Uses Natural Gas
- Storage Tank
- Cable TV Available
Map
Home Values in the Area
Average Home Value in this Area
Tax History
| Year | Tax Paid | Tax Assessment Tax Assessment Total Assessment is a certain percentage of the fair market value that is determined by local assessors to be the total taxable value of land and additions on the property. | Land | Improvement |
|---|---|---|---|---|
| 2025 | $5,283 | $294,500 | $90,500 | $204,000 |
| 2024 | $5,229 | $283,400 | $90,500 | $192,900 |
| 2023 | $4,877 | $266,200 | $90,500 | $175,700 |
| 2022 | $4,558 | $245,600 | $90,500 | $155,100 |
| 2021 | $4,460 | $231,700 | $90,500 | $141,200 |
| 2020 | $4,177 | $211,900 | $75,500 | $136,400 |
| 2019 | $3,942 | $203,000 | $70,500 | $132,500 |
| 2018 | $3,864 | $193,100 | $65,500 | $127,600 |
| 2017 | $3,500 | $178,300 | $55,500 | $122,800 |
| 2016 | $3,375 | $179,900 | $55,500 | $124,400 |
| 2015 | $3,249 | $179,900 | $55,500 | $124,400 |
Property History
| Date | Event | Price | List to Sale | Price per Sq Ft |
|---|---|---|---|---|
| 11/11/2025 11/11/25 | Price Changed | $379,000 | -2.6% | $208 / Sq Ft |
| 10/29/2025 10/29/25 | For Sale | $389,000 | -- | $213 / Sq Ft |
Purchase History
| Date | Type | Sale Price | Title Company |
|---|---|---|---|
| Quit Claim Deed | -- | None Available | |
| Quit Claim Deed | -- | None Available | |
| Quit Claim Deed | -- | None Available | |
| Quit Claim Deed | -- | None Available | |
| Quit Claim Deed | -- | None Available | |
| Deed | $124,800 | -- |
Mortgage History
| Date | Status | Loan Amount | Loan Type |
|---|---|---|---|
| Previous Owner | $35,000 | No Value Available | |
| Previous Owner | $65,000 | No Value Available |
Source: Berkshire County Board of REALTORS®
MLS Number: 248118
APN: PITT-000004K-000001-000003
Disclaimer: Certain information contained herein is derived from information provided by parties other than Homes.com. All information provided is deemed reliable, but is not guaranteed to be accurate and should be independently verified.
![]() IDX information is provided exclusively for consumers' personal, non-commercial use, that it may not be used for any purpose other than to identify prospective properties consumers may be interested in purchasing. Information deemed to be reliable but not guaranteed.
IDX information is provided exclusively for consumers' personal, non-commercial use, that it may not be used for any purpose other than to identify prospective properties consumers may be interested in purchasing. Information deemed to be reliable but not guaranteed.
The data relating to real estate for sale on this website comes from Berkshire County Board of Realtors and the Broker Reciprocity Program.
Copyright 2025 Berkshire County Board of Realtors. All rights reserved.
- 31 Eric Dr
- 36 Joseph Dr
- 51 Anita Dr
- 612 E New Lenox Rd
- 57 Palomino Dr
- 889 Holmes Rd
- 851 E New Lenox Rd
- 69 Gravesleigh Terrace
- 20 Marshall Ave
- 68 Brookside Dr
- 35 Chapman Rd
- 381 Williams St
- 106 Sampson Pkwy
- 565 Williams St
- 40 Sampson Pkwy
- 1070 Holmes Rd
- 59 Joan Dr
- 4 Filomena Dr
- 39 Lexington Pkwy
- 31 Lexington Pkwy
- 59 Bartlett Ave
- 59 Bartlett Ave
- 5 Whipple St
- 57 Bartlett Ave
- 57 Bartlett Ave
- 20 Allessio St Unit 20
- 10 Wendell Avenue Extension
- 20 Bank Row
- 7 West St
- 113 West St
- 34 Depot St
- 99 Hawthorne Ave
- 6 Cherry St Unit 6A
- 324 North St
- 44 Robbins Ave
- 44 Robbins Ave
- 44 Robbins Ave
- 241 Second St
- 284 Dalton Division Rd
- 105 Parker St Unit 3