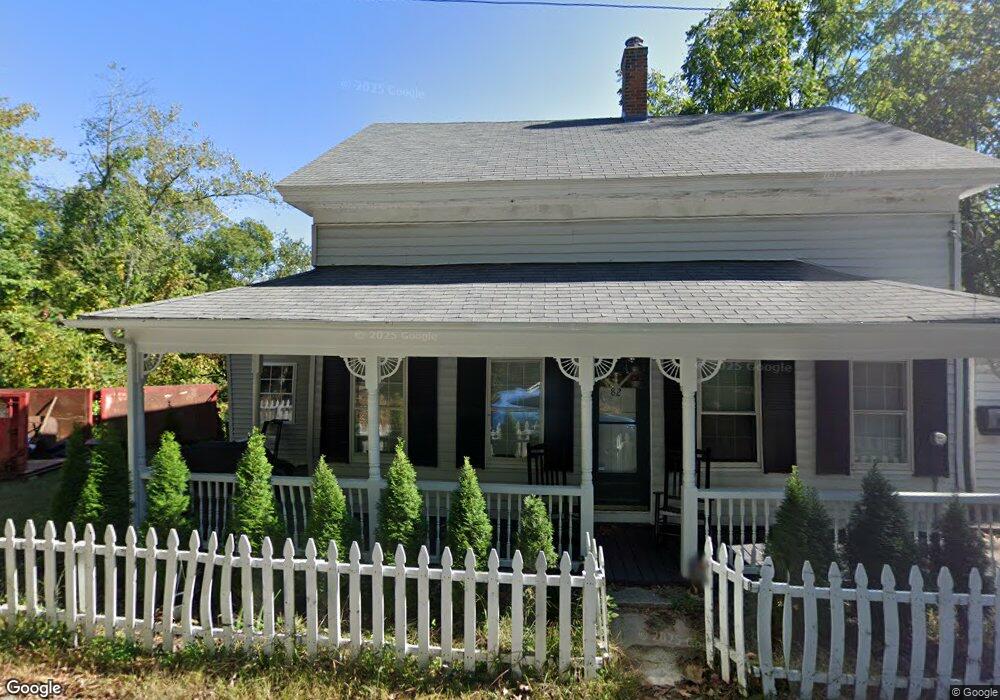
82 Rock Ave Pascoag, RI 02859
Estimated Value: $405,123 - $452,000
4
Beds
1
Bath
1,579
Sq Ft
$270/Sq Ft
Est. Value
About This Home
This home is located at 82 Rock Ave, Pascoag, RI 02859 and is currently estimated at $427,031, approximately $270 per square foot. 82 Rock Ave is a home with nearby schools including Austin T. Levy School, Burrillville Middle School, and Burrillville High School.
Ownership History
Date
Name
Owned For
Owner Type
Purchase Details
Closed on
Feb 27, 2017
Sold by
Levesque Deborah A
Bought by
Levesque Deborah A
Current Estimated Value
Purchase Details
Closed on
Oct 1, 1981
Bought by
Levesque Donald J and Levesque Deborah A
Create a Home Valuation Report for This Property
The Home Valuation Report is an in-depth analysis detailing your home's value as well as a comparison with similar homes in the area
Home Values in the Area
Average Home Value in this Area
Purchase History
| Date | Buyer | Sale Price | Title Company |
|---|---|---|---|
| Levesque Deborah A | -- | -- | |
| Levesque Donald J | -- | -- |
Source: Public Records
Mortgage History
| Date | Status | Borrower | Loan Amount |
|---|---|---|---|
| Previous Owner | Levesque Donald J | $189,800 | |
| Previous Owner | Levesque Donald J | $196,000 | |
| Previous Owner | Levesque Donald J | $100,000 | |
| Previous Owner | Levesque Donald J | $85,000 |
Source: Public Records
Tax History
| Year | Tax Paid | Tax Assessment Tax Assessment Total Assessment is a certain percentage of the fair market value that is determined by local assessors to be the total taxable value of land and additions on the property. | Land | Improvement |
|---|---|---|---|---|
| 2025 | $3,989 | $335,200 | $86,400 | $248,800 |
| 2024 | $3,758 | $250,900 | $69,100 | $181,800 |
| 2023 | $3,610 | $250,900 | $69,100 | $181,800 |
| 2022 | $3,490 | $250,900 | $69,100 | $181,800 |
| 2021 | $3,307 | $201,400 | $71,400 | $130,000 |
| 2020 | $3,224 | $201,400 | $71,400 | $130,000 |
| 2019 | $3,222 | $201,400 | $71,400 | $130,000 |
| 2018 | $2,987 | $164,100 | $64,100 | $100,000 |
| 2017 | $2,882 | $164,100 | $64,100 | $100,000 |
| 2016 | $2,854 | $164,100 | $64,100 | $100,000 |
| 2015 | $2,726 | $144,400 | $64,700 | $79,700 |
| 2014 | $2,726 | $144,400 | $64,700 | $79,700 |
Source: Public Records
Map
Nearby Homes
- 94 Sayles Ave
- 156 Broad St
- 161 Sayles Ave
- 393 Church St
- 248 Church St
- 248-252 Church St
- 265 Sayles Ave Unit 1
- 420 Reservoir Rd
- 75 Marion Ave
- 31 Marion Ave
- 43 Laurel Hill Ave
- 490 Court House Ln
- 14 Avery Ln
- 23 Avery Ln
- 20 Avery Ln
- 361 Chapel St
- 0 Mowry St
- 146 Railroad Ave
- 311 Chapel St
- 74 Crystal Terrace
Your Personal Tour Guide
Ask me questions while you tour the home.