


82 S Broadway Lawrence, MA 01843
South Common NeighborhoodEstimated payment $19,003/month
Highlights
- Property is near public transit and schools
- Shops
- Level Lot
About This Home
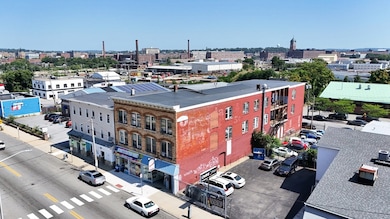
This 41-unit mixed-use building consists of (3) commercial units and (38) SRO (single room occupancy) units. The property sits on 0.16 acres with 17,706 SF of living area in 24,502 gross square feet. This asset is well-maintained, featuring a new roof, a new heating system, and a state-of-the-art security system. All upgrades to the building have been completed in the past 3 years. The property is well-positioned on the south side of Lawrence and provides direct access to Boston via Interstates 93 and 495, MA Route 28, and The Lawrence Train Station with service on the MBTA’s Haverhill Line (0.6 miles). The property is walkable to local retail establishments, eateries, grocery stores, and parks. The cap rate upon acquisition is 9.30%. Seller will consider other property in trade to help accommodate a 1031 exchange.
Property Details
Home Type
- Multi-Family
Est. Annual Taxes
- $26,240
Year Built
- Built in 1900
Lot Details
- 6,995 Sq Ft Lot
- Level Lot
Parking
- Open Parking
Home Design
- Brick Exterior Construction
- Brick Foundation
- Rubber Roof
Interior Spaces
- 17,706 Sq Ft Home
- 3-Story Property
- Basement Fills Entire Space Under The House
Bedrooms and Bathrooms
- 38 Bedrooms
- 7 Full Bathrooms
Location
- Property is near public transit and schools
Listing and Financial Details
- Assessor Parcel Number 4205642
Community Details
Building Details
- Insurance Expense $27,277
- Water Sewer Expense $6,295
- Operating Expense $163,582
- Net Operating Income $297,733
Additional Features
- 41 Units
- Shops
Map
Home Values in the Area
Average Home Value in this Area
Tax History
| Year | Tax Paid | Tax Assessment Tax Assessment Total Assessment is a certain percentage of the fair market value that is determined by local assessors to be the total taxable value of land and additions on the property. | Land | Improvement |
|---|---|---|---|---|
| 2025 | -- | $2,342,400 | $186,400 | $2,156,000 |
| 2024 | -- | $2,327,500 | $147,100 | $2,180,400 |
| 2023 | $0 | $2,021,900 | $122,700 | $1,899,200 |
| 2022 | $0 | $1,132,300 | $111,900 | $1,020,400 |
| 2021 | $0 | $959,800 | $111,900 | $847,900 |
| 2020 | $0 | $943,800 | $103,800 | $840,000 |
| 2019 | $0 | $775,200 | $110,200 | $665,000 |
| 2018 | $0 | $704,000 | $99,800 | $604,200 |
| 2017 | $0 | $668,900 | $91,100 | $577,800 |
| 2016 | -- | $628,600 | $86,400 | $542,200 |
| 2015 | -- | $628,600 | $86,400 | $542,200 |
Property History
| Date | Event | Price | List to Sale | Price per Sq Ft |
|---|---|---|---|---|
| 03/13/2026 03/13/26 | Price Changed | $3,150,000 | -1.6% | $178 / Sq Ft |
| 11/12/2025 11/12/25 | For Sale | $3,200,000 | -- | $181 / Sq Ft |
Purchase History
| Date | Type | Sale Price | Title Company |
|---|---|---|---|
| Quit Claim Deed | $2,100,000 | None Available | |
| Quit Claim Deed | $2,200,000 | None Available | |
| Quit Claim Deed | $880,000 | -- | |
| Land Court Massachusetts | -- | -- | |
| Land Court Massachusetts | -- | -- |
Mortgage History
| Date | Status | Loan Amount | Loan Type |
|---|---|---|---|
| Open | $1,900,000 | Commercial | |
| Previous Owner | $515,000 | Commercial | |
| Closed | $0 | Commercial |
Source: MLS Property Information Network (MLS PIN)
MLS Number: 73454121
APN: LAWR-000121-000000-000043
Disclaimer: Certain information contained herein is derived from information provided by parties other than Homes.com. All information provided is deemed reliable, but is not guaranteed to be accurate and should be independently verified.
![]() The property listing data and information, or the Images, set forth herein were provided to MLS Property Information Network, Inc. from third party sources, including sellers, lessors and public records, and were compiled by MLS Property Information Network, Inc. The property listing data and information, and the Images, are for the personal, non-commercial use of consumers having a good faith interest in purchasing or leasing listed properties of the type displayed to them and may not be used for any purpose other than to identify prospective properties which such consumers may have a good faith interest in purchasing or leasing. MLS Property Information Network, Inc. and its subscribers disclaim any and all representations and warranties as to the accuracy of the property listing data and information, or as to the accuracy of any of the Images, set forth herein.
The property listing data and information, or the Images, set forth herein were provided to MLS Property Information Network, Inc. from third party sources, including sellers, lessors and public records, and were compiled by MLS Property Information Network, Inc. The property listing data and information, and the Images, are for the personal, non-commercial use of consumers having a good faith interest in purchasing or leasing listed properties of the type displayed to them and may not be used for any purpose other than to identify prospective properties which such consumers may have a good faith interest in purchasing or leasing. MLS Property Information Network, Inc. and its subscribers disclaim any and all representations and warranties as to the accuracy of the property listing data and information, or as to the accuracy of any of the Images, set forth herein.
- 91-93 Newton St
- 100 Bailey St Unit 1
- 49 Bowdoin St Unit 51
- 82 Water St
- 28-32 Chester St
- 22-26 Chandler St
- 33-35 Coolidge St
- 18 Winthrop Ave
- 151-153 Bailey St
- 11 Cambridge St
- 161-167 S Union St
- 31 Garfield St
- 143 Foster St
- 27-29 Dorchester St
- 46-46A Dorchester St
- 110-112 Everett St
- 543 Andover St Unit 6
- 356-360 S Union St
- 118-120 Everett St
- 100 Hancock St
- 93 S Broadway Unit 5
- 120 Springfield St Unit 3
- 296 S Broadway Unit 2
- 300 Methuen St
- 84 Salem St Unit 84 salem st 2 floor B
- 300 Canal St Unit 1-541
- 300 Canal St Unit 1-542
- 300 Canal St Unit 5-101
- 300 Canal St Unit 8-506
- 300 Canal St Unit 6-512
- 300 Canal St Unit 5-103
- 302 Canal St Unit 7-04
- 302 Canal St Unit 7-07
- 300 Canal St
- 83 Cambridge St Unit 1
- 240 Canal St
- 1 S Union St
- 52 - 54 Margin St Unit 4
- 2 Museum Square
- 24 Inman St Unit 28

Ask me questions while you tour the home.