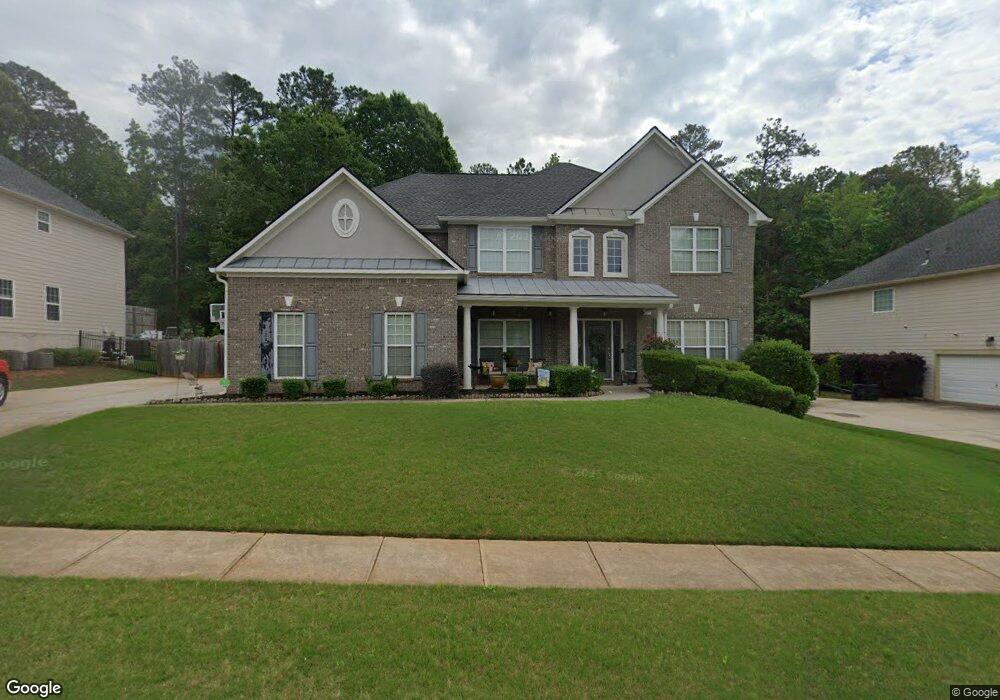
82 Stonebridge Blvd Newnan, GA 30265
Estimated Value: $490,102 - $512,000
--
Bed
4
Baths
3,583
Sq Ft
$140/Sq Ft
Est. Value
About This Home
This home is located at 82 Stonebridge Blvd, Newnan, GA 30265 and is currently estimated at $501,276, approximately $139 per square foot. 82 Stonebridge Blvd is a home located in Coweta County with nearby schools including Newnan Crossing Elementary School, Arnall Middle School, and East Coweta High School.
Ownership History
Date
Name
Owned For
Owner Type
Purchase Details
Closed on
Apr 12, 2021
Sold by
Fallon Joann
Bought by
Fenech Jason J
Current Estimated Value
Home Financials for this Owner
Home Financials are based on the most recent Mortgage that was taken out on this home.
Original Mortgage
$300,000
Outstanding Balance
$270,497
Interest Rate
3.05%
Mortgage Type
New Conventional
Estimated Equity
$230,779
Purchase Details
Closed on
Feb 28, 2006
Sold by
Ryland Group Inc
Bought by
Fallon Joann and Fallon Victor
Home Financials for this Owner
Home Financials are based on the most recent Mortgage that was taken out on this home.
Original Mortgage
$265,572
Interest Rate
6.04%
Mortgage Type
New Conventional
Purchase Details
Closed on
Sep 28, 2005
Sold by
Stonebridge @ Newnan Crossing
Bought by
The Ryland Group Inc
Purchase Details
Closed on
Jun 19, 2003
Sold by
Newnan Crossing Partnership
Bought by
Stonebridge @ Newnan Crossing Llc
Create a Home Valuation Report for This Property
The Home Valuation Report is an in-depth analysis detailing your home's value as well as a comparison with similar homes in the area
Home Values in the Area
Average Home Value in this Area
Purchase History
| Date | Buyer | Sale Price | Title Company |
|---|---|---|---|
| Fenech Jason J | $375,000 | -- | |
| Fallon Joann | $332,000 | -- | |
| The Ryland Group Inc | $410,800 | -- | |
| Stonebridge @ Newnan Crossing Llc | $6,921,900 | -- |
Source: Public Records
Mortgage History
| Date | Status | Borrower | Loan Amount |
|---|---|---|---|
| Open | Fenech Jason J | $300,000 | |
| Previous Owner | Fallon Joann | $265,572 |
Source: Public Records
Tax History Compared to Growth
Tax History
| Year | Tax Paid | Tax Assessment Tax Assessment Total Assessment is a certain percentage of the fair market value that is determined by local assessors to be the total taxable value of land and additions on the property. | Land | Improvement |
|---|---|---|---|---|
| 2025 | $4,537 | $197,888 | $30,000 | $167,888 |
| 2024 | $4,123 | $183,826 | $30,000 | $153,826 |
| 2023 | $4,123 | $182,796 | $26,000 | $156,796 |
| 2022 | $3,565 | $171,479 | $26,000 | $145,479 |
| 2021 | $2,206 | $138,582 | $16,000 | $122,582 |
| 2020 | $2,705 | $138,582 | $16,000 | $122,582 |
| 2019 | $2,979 | $126,411 | $16,000 | $110,411 |
| 2018 | $3,000 | $126,411 | $16,000 | $110,411 |
| 2017 | $2,845 | $121,811 | $16,000 | $105,811 |
| 2016 | $2,545 | $111,690 | $16,000 | $95,690 |
| 2015 | $2,364 | $105,690 | $10,000 | $95,690 |
| 2014 | $3,003 | $102,010 | $10,000 | $92,010 |
Source: Public Records
Map
Nearby Homes
- 24 Stonebridge Pass
- 361 Granite Way
- 80 Creekside Way
- 8 Bryce Creek Dr
- 93 Greentree Dr
- 37 Greentree Dr
- 140 Greentree Dr
- 20 Bryce Creek Dr
- 146 Greentree Dr
- 9 Ravine Dr
- 49 Granite Way
- 152 Stonebridge Crossing
- 16 Daybreak Ln
- 274 Daybreak Ln
- 212 Daybreak Ln
- 206 Daybreak Ln
- 204 Daybreak Ln
- 7 Paw Ln
- 186 Granite Way
- 35 Canyon View Dr
- 82 Stonebridge Blvd Unit 159
- 78 Stonebridge Blvd
- 86 Stonebridge Blvd
- 88 Stonebridge Blvd
- 88 Stonebridge Blvd Unit 608
- 88 Stonebridge Blvd
- 88 Stonebridge Blvd
- 74 Stonebridge Blvd
- 75 Stonebridge Blvd
- 79 Stonebridge Blvd
- 92 Stonebridge Blvd
- 3 Boulder Bend
- 7 Stonebridge Pass Unit 152
- 7 Stonebridge Pass
- 2 Cobblestone Dr
- 70 Stonebridge Blvd
- 196 Bridgewater Ln
- 6 Stonebridge Pass
- 7 Boulder Bend
- 7 Boulder Bend Unit 575