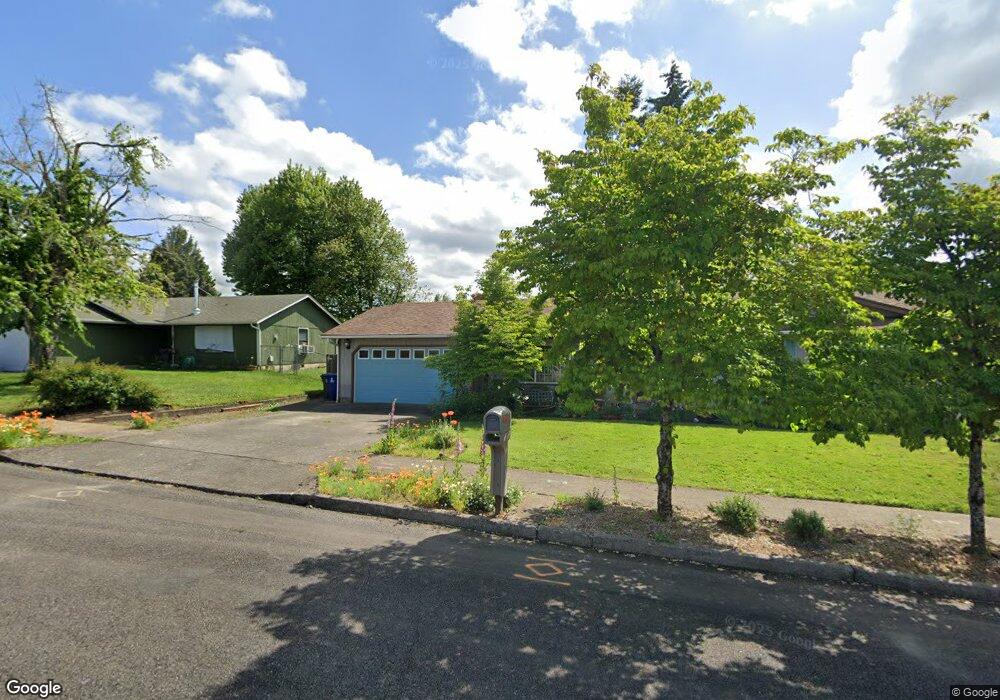
82 SW Emerald Place Sublimity, OR 97385
Estimated Value: $455,976 - $543,000
4
Beds
3
Baths
1,848
Sq Ft
$271/Sq Ft
Est. Value
About This Home
This home is located at 82 SW Emerald Place, Sublimity, OR 97385 and is currently estimated at $500,744, approximately $270 per square foot. 82 SW Emerald Place is a home located in Marion County with nearby schools including Sublimity Elementary School, Stayton High School, and St. Mary Catholic School.
Ownership History
Date
Name
Owned For
Owner Type
Purchase Details
Closed on
Oct 23, 2013
Sold by
Harrold Ronnelle L
Bought by
Harrold Ronnelle L and Ronnelle L Harrold Revocable Living Trus
Current Estimated Value
Purchase Details
Closed on
Dec 9, 2004
Sold by
Parker Daniel J and Parker Patricia A
Bought by
Harrold Jerry L and Harrold Ronelle L
Home Financials for this Owner
Home Financials are based on the most recent Mortgage that was taken out on this home.
Original Mortgage
$130,000
Outstanding Balance
$64,080
Interest Rate
5.7%
Mortgage Type
Purchase Money Mortgage
Estimated Equity
$436,664
Purchase Details
Closed on
May 10, 2004
Sold by
Parker Daniel J
Bought by
Parker Patricia A
Purchase Details
Closed on
Aug 30, 2002
Sold by
Ogden Steven E and Adams Ogden Kimberly Lynn
Bought by
Parker Daniel J
Home Financials for this Owner
Home Financials are based on the most recent Mortgage that was taken out on this home.
Original Mortgage
$119,790
Interest Rate
6.29%
Mortgage Type
Purchase Money Mortgage
Create a Home Valuation Report for This Property
The Home Valuation Report is an in-depth analysis detailing your home's value as well as a comparison with similar homes in the area
Home Values in the Area
Average Home Value in this Area
Purchase History
| Date | Buyer | Sale Price | Title Company |
|---|---|---|---|
| Harrold Ronnelle L | -- | None Available | |
| Harrold Jerry L | $148,650 | Fidelity Natl Title Co Of Or | |
| Parker Patricia A | $135,000 | -- | |
| Parker Daniel J | $133,100 | Fidelity National Title Co |
Source: Public Records
Mortgage History
| Date | Status | Borrower | Loan Amount |
|---|---|---|---|
| Open | Harrold Jerry L | $130,000 | |
| Previous Owner | Parker Daniel J | $119,790 |
Source: Public Records
Tax History Compared to Growth
Tax History
| Year | Tax Paid | Tax Assessment Tax Assessment Total Assessment is a certain percentage of the fair market value that is determined by local assessors to be the total taxable value of land and additions on the property. | Land | Improvement |
|---|---|---|---|---|
| 2025 | $2,983 | $241,240 | -- | -- |
| 2024 | $2,983 | $234,220 | -- | -- |
| 2023 | $2,900 | $227,400 | $0 | $0 |
| 2022 | $2,702 | $220,780 | $0 | $0 |
| 2021 | $2,627 | $214,350 | $0 | $0 |
| 2020 | $2,552 | $208,110 | $0 | $0 |
| 2019 | $2,477 | $202,050 | $0 | $0 |
| 2018 | $2,512 | $0 | $0 | $0 |
| 2017 | $2,446 | $0 | $0 | $0 |
| 2016 | $2,381 | $0 | $0 | $0 |
| 2015 | $2,308 | $0 | $0 | $0 |
| 2014 | $1,902 | $0 | $0 | $0 |
Source: Public Records
Map
Nearby Homes
- 503 SW Mistmaiden Ct
- Lot 200 Golf Ln
- 0 Golf Ln
- 707 NW George Ct
- 704 NW George Ct
- 708 NW George Ct
- 714 NW Charles (-716 Nw George Ct) Ln
- 130 NW Crater St
- 229 NE Maple St
- 212 NE Broadway St
- 220 NW Downy Dr
- 557 SE Arbor St
- 310 NE Clay St
- 311 NE Clay St
- 313 NE Clay St
- 319 NE Clay St
- 340 NE Crest St
- 340 NE Crest St Unit 18
- 340 NE Crest St Unit 71
- 429 SE Palomino Ct
- 80 SW Emerald Place
- 84 SW Emerald Place
- 513 SW 9th St
- 803 SW Dalmatian St
- 803 SW Dalmation St
- 801 SW Dalmation St
- 74 SW Emerald Place
- 805 SW Dalmation St
- 83 SW Emerald Place
- 85 SW Emerald Place
- 81 SW Emerald Place
- 705 SW Dalmatian St
- 705 SW Dalmation St
- 72 SW Emerald Place
- 73 SW Emerald Place
- 613 SW 9th St
- 514 SW 9th St
- 70 SW Emerald Place
- 512 SW 9th St
- 516 SW 9th St