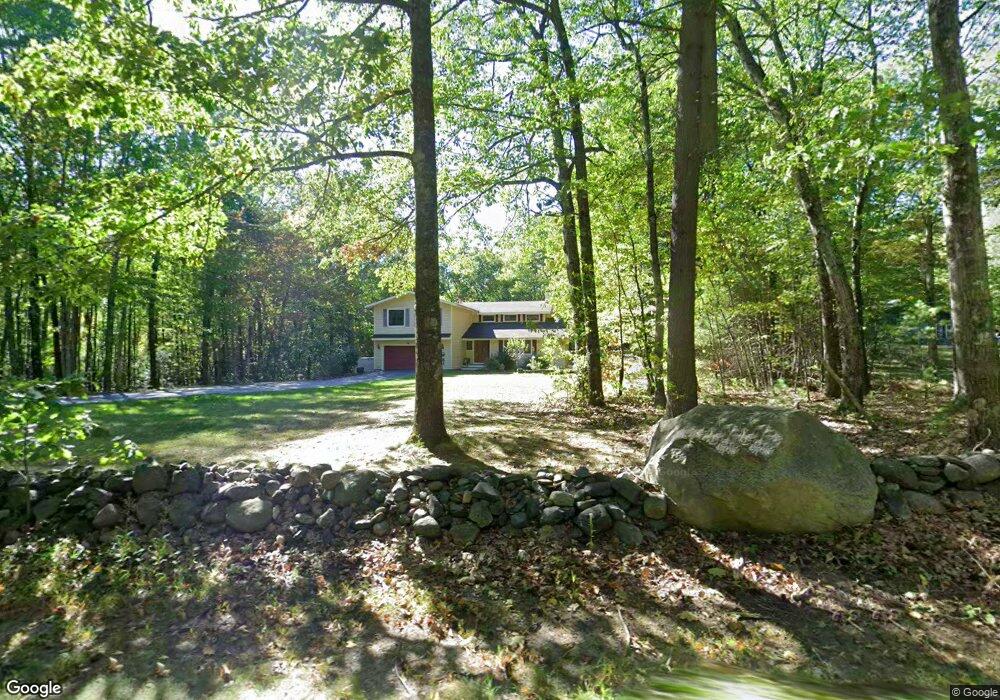
82 Townsend Rd Shirley, MA 01464
Estimated Value: $575,000 - $643,000
3
Beds
3
Baths
2,400
Sq Ft
$251/Sq Ft
Est. Value
About This Home
This home is located at 82 Townsend Rd, Shirley, MA 01464 and is currently estimated at $602,304, approximately $250 per square foot. 82 Townsend Rd is a home located in Middlesex County with nearby schools including Page Hilltop School, Lura A. White Elementary School, and Ayer Shirley Regional Middle School.
Ownership History
Date
Name
Owned For
Owner Type
Purchase Details
Closed on
Mar 30, 2007
Sold by
Sweeney Dennis P and Sweeney Kiyomi
Bought by
Sweeney Dennis P and Sweeney Kiyomi
Current Estimated Value
Purchase Details
Closed on
Apr 20, 2001
Sold by
Ortiz Jose I and Deoritz Juliana L
Bought by
Sweeney Dennis P and Sweeney Kiyomi
Home Financials for this Owner
Home Financials are based on the most recent Mortgage that was taken out on this home.
Original Mortgage
$215,920
Interest Rate
6.9%
Mortgage Type
Purchase Money Mortgage
Purchase Details
Closed on
Jul 3, 1996
Sold by
Smith David R and Lowell Amy J
Bought by
Ortiz Juliana L and Ortiz Jose I
Home Financials for this Owner
Home Financials are based on the most recent Mortgage that was taken out on this home.
Original Mortgage
$139,500
Interest Rate
7.98%
Mortgage Type
Purchase Money Mortgage
Purchase Details
Closed on
Oct 13, 1992
Sold by
Kim Byung Kyo and Kim Eun Sook
Bought by
Smith David R and Lovell Amy J
Home Financials for this Owner
Home Financials are based on the most recent Mortgage that was taken out on this home.
Original Mortgage
$129,093
Interest Rate
7.99%
Mortgage Type
Purchase Money Mortgage
Create a Home Valuation Report for This Property
The Home Valuation Report is an in-depth analysis detailing your home's value as well as a comparison with similar homes in the area
Home Values in the Area
Average Home Value in this Area
Purchase History
| Date | Buyer | Sale Price | Title Company |
|---|---|---|---|
| Sweeney Dennis P | -- | -- | |
| Sweeney Dennis P | -- | -- | |
| Young James D | -- | -- | |
| Sweeney Dennis P | $269,900 | -- | |
| Ortiz Juliana L | $155,000 | -- | |
| Smith David R | $141,500 | -- |
Source: Public Records
Mortgage History
| Date | Status | Borrower | Loan Amount |
|---|---|---|---|
| Previous Owner | Smith David R | $215,920 | |
| Previous Owner | Smith David R | $133,000 | |
| Previous Owner | Smith David R | $139,500 | |
| Previous Owner | Smith David R | $129,093 |
Source: Public Records
Tax History
| Year | Tax Paid | Tax Assessment Tax Assessment Total Assessment is a certain percentage of the fair market value that is determined by local assessors to be the total taxable value of land and additions on the property. | Land | Improvement |
|---|---|---|---|---|
| 2025 | $64 | $494,600 | $136,800 | $357,800 |
| 2024 | $6,211 | $457,700 | $125,100 | $332,600 |
| 2023 | $5,985 | $422,100 | $125,100 | $297,000 |
| 2022 | $5,607 | $362,200 | $121,200 | $241,000 |
| 2021 | $5,572 | $337,100 | $109,400 | $227,700 |
| 2020 | $5,297 | $328,800 | $109,400 | $219,400 |
| 2019 | $5,223 | $324,800 | $109,400 | $215,400 |
| 2018 | $5,015 | $305,400 | $104,800 | $200,600 |
| 2017 | $4,842 | $293,100 | $101,600 | $191,500 |
| 2016 | $4,639 | $281,000 | $101,600 | $179,400 |
| 2015 | $4,797 | $277,100 | $100,100 | $177,000 |
Source: Public Records
Map
Nearby Homes
- 105 Townsend Rd Unit 1
- 92 Squannacook Rd
- 24 Townsend Rd
- 111 Squannacook Rd
- 22 Townsend Rd
- 44 Squannacook Rd
- 43 Longley Rd
- Lot 5 Townsend Rd
- 26 Bluebird Ln
- 367 Mulpus Rd
- 26 Bradley Dr Unit D
- 17 Longley Rd
- 11 Longley Rd Unit K8
- 11 Longley Rd Unit G3
- Lot 10 Christian Cir
- 146 Elmwood Rd
- 12 Cortland Cir Unit 12
- 15 Hayes Woods Ln
- 137 Hill Rd
- Lot 3 Maple Ave
- 84 Townsend Rd
- 101C Townsend Rd Unit 1
- 80 Townsend Rd
- 88 Townsend Rd Unit D
- 88 Townsend Rd Unit C
- 88 Townsend Rd Unit B
- 88 Townsend Rd Unit A
- 88 Townsend Rd Unit 88 A
- 88 Townsend Rd Unit 1
- 72 Townsend Rd
- 4 Fairway Dr
- 92 Townsend Rd
- 13 Garrison Rd
- 3 Fairway Dr
- 90 Townsend Rd
- 1 Fairway Dr
- 12 Garrison Rd
- 11 Garrison Rd
- 111 Groton Rd
- 119 Groton Rd
Your Personal Tour Guide
Ask me questions while you tour the home.