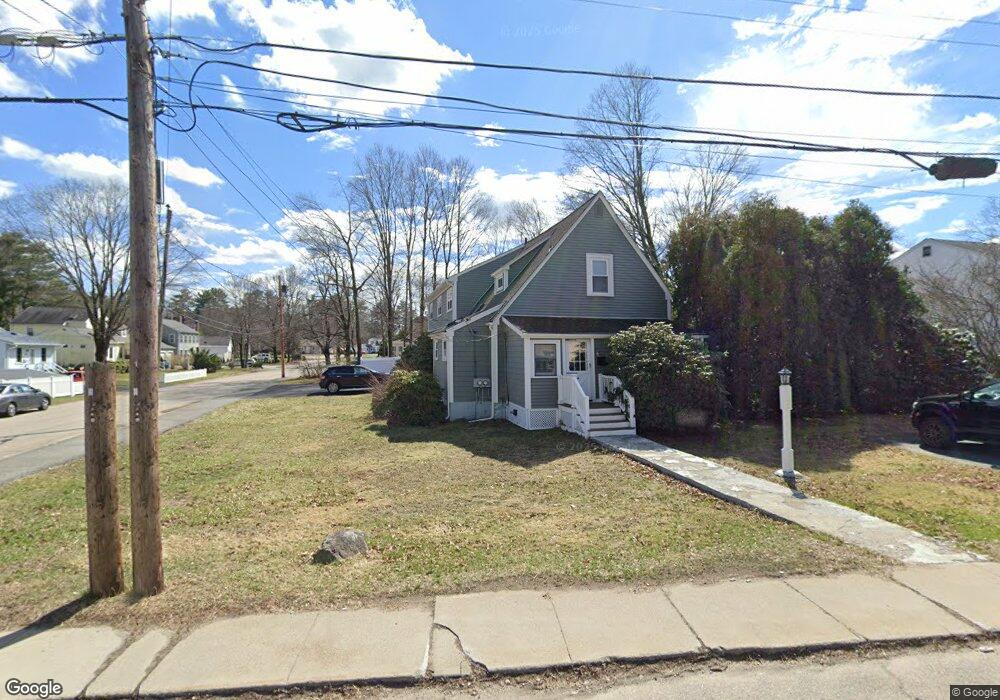
82 Union St Millis, MA 02054
Estimated Value: $536,643 - $764,000
4
Beds
3
Baths
2,041
Sq Ft
$327/Sq Ft
Est. Value
About This Home
This home is located at 82 Union St, Millis, MA 02054 and is currently estimated at $667,411, approximately $327 per square foot. 82 Union St is a home located in Norfolk County with nearby schools including Clyde F Brown, Millis Middle School, and Millis High School.
Ownership History
Date
Name
Owned For
Owner Type
Purchase Details
Closed on
Sep 17, 1996
Sold by
Larose Richard J and Larose Donna A
Bought by
Mitchell Robert K and Mitchell Debra J
Current Estimated Value
Home Financials for this Owner
Home Financials are based on the most recent Mortgage that was taken out on this home.
Original Mortgage
$134,900
Interest Rate
8.18%
Mortgage Type
Purchase Money Mortgage
Create a Home Valuation Report for This Property
The Home Valuation Report is an in-depth analysis detailing your home's value as well as a comparison with similar homes in the area
Home Values in the Area
Average Home Value in this Area
Purchase History
| Date | Buyer | Sale Price | Title Company |
|---|---|---|---|
| Mitchell Robert K | $142,000 | -- |
Source: Public Records
Mortgage History
| Date | Status | Borrower | Loan Amount |
|---|---|---|---|
| Open | Mitchell Robert K | $85,000 | |
| Closed | Mitchell Robert K | $132,000 | |
| Closed | Mitchell Robert K | $134,900 |
Source: Public Records
Tax History
| Year | Tax Paid | Tax Assessment Tax Assessment Total Assessment is a certain percentage of the fair market value that is determined by local assessors to be the total taxable value of land and additions on the property. | Land | Improvement |
|---|---|---|---|---|
| 2025 | $6,831 | $416,500 | $233,200 | $183,300 |
| 2024 | $6,588 | $401,200 | $215,300 | $185,900 |
| 2023 | $6,321 | $361,400 | $171,600 | $189,800 |
| 2022 | $6,808 | $360,600 | $184,100 | $176,500 |
| 2021 | $5,853 | $298,300 | $159,100 | $139,200 |
| 2020 | $5,617 | $278,900 | $148,700 | $130,200 |
| 2019 | $4,946 | $264,500 | $135,600 | $128,900 |
| 2018 | $4,766 | $264,500 | $135,600 | $128,900 |
| 2017 | $4,657 | $252,800 | $116,100 | $136,700 |
| 2016 | $4,386 | $251,500 | $116,100 | $135,400 |
| 2015 | $4,276 | $251,500 | $116,100 | $135,400 |
Source: Public Records
Map
Nearby Homes
Your Personal Tour Guide
Ask me questions while you tour the home.