82 Upland Rd Unit 2 Brockton, MA 02301
Estimated Value: $673,039 - $750,000
6
Beds
2
Baths
2,408
Sq Ft
$295/Sq Ft
Est. Value
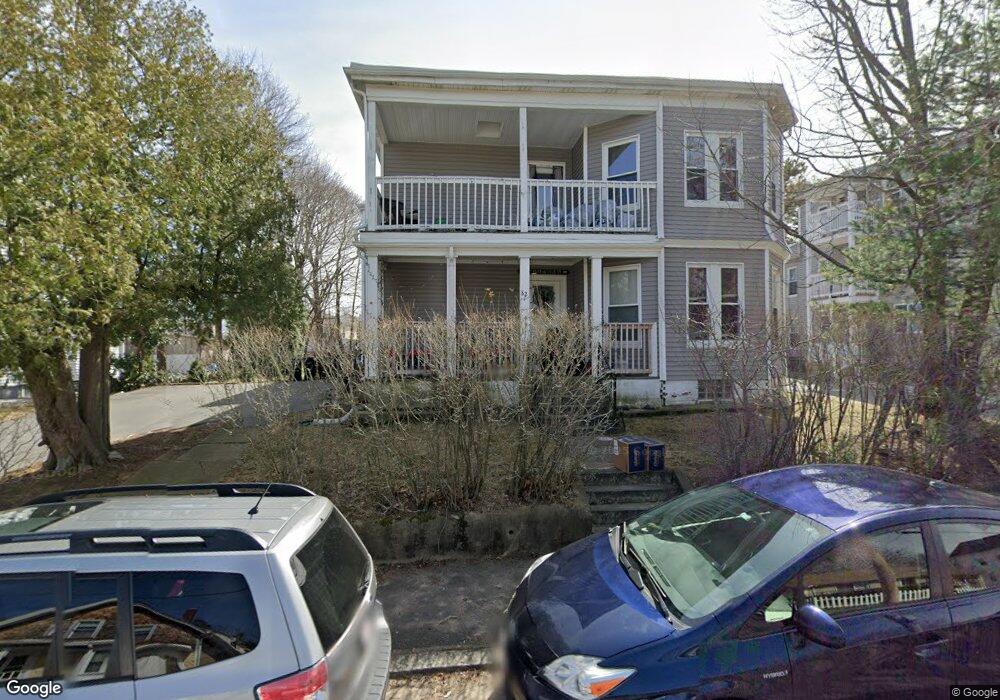
About This Home
This home is located at 82 Upland Rd Unit 2, Brockton, MA 02301 and is currently estimated at $710,760, approximately $295 per square foot. 82 Upland Rd Unit 2 is a home located in Plymouth County with nearby schools including Louis F Angelo Elementary School, Manthala George Jr. School, and Raymond K-8 Elementary School.
Ownership History
Date
Name
Owned For
Owner Type
Purchase Details
Closed on
Aug 18, 2011
Sold by
Shoe City Props Llc
Bought by
Monahan Patrick J
Current Estimated Value
Home Financials for this Owner
Home Financials are based on the most recent Mortgage that was taken out on this home.
Original Mortgage
$243,662
Outstanding Balance
$170,116
Interest Rate
4.75%
Mortgage Type
FHA
Estimated Equity
$540,644
Purchase Details
Closed on
Oct 28, 2010
Sold by
Pais-Spears Grace
Bought by
Shoe City Prop Llc and Friece William D
Home Financials for this Owner
Home Financials are based on the most recent Mortgage that was taken out on this home.
Original Mortgage
$172,280
Interest Rate
4.39%
Mortgage Type
Purchase Money Mortgage
Purchase Details
Closed on
May 15, 2008
Sold by
Munies Barbara and Mckernan Kathleen
Bought by
Spears Grace Pais
Home Financials for this Owner
Home Financials are based on the most recent Mortgage that was taken out on this home.
Original Mortgage
$225,000
Interest Rate
5.91%
Mortgage Type
Purchase Money Mortgage
Create a Home Valuation Report for This Property
The Home Valuation Report is an in-depth analysis detailing your home's value as well as a comparison with similar homes in the area
Home Values in the Area
Average Home Value in this Area
Purchase History
| Date | Buyer | Sale Price | Title Company |
|---|---|---|---|
| Monahan Patrick J | $250,000 | -- | |
| Shoe City Prop Llc | $90,000 | -- | |
| Spears Grace Pais | $250,000 | -- |
Source: Public Records
Mortgage History
| Date | Status | Borrower | Loan Amount |
|---|---|---|---|
| Open | Monahan Patrick J | $243,662 | |
| Previous Owner | Spears Grace Pais | $34,720 | |
| Previous Owner | Shoe City Prop Llc | $172,280 | |
| Previous Owner | Spears Grace Pais | $225,000 |
Source: Public Records
Tax History Compared to Growth
Tax History
| Year | Tax Paid | Tax Assessment Tax Assessment Total Assessment is a certain percentage of the fair market value that is determined by local assessors to be the total taxable value of land and additions on the property. | Land | Improvement |
|---|---|---|---|---|
| 2025 | $7,956 | $657,000 | $140,500 | $516,500 |
| 2024 | $7,838 | $652,100 | $140,500 | $511,600 |
| 2023 | $6,935 | $534,300 | $106,500 | $427,800 |
| 2022 | $6,741 | $482,500 | $96,900 | $385,600 |
| 2021 | $6,718 | $463,300 | $80,900 | $382,400 |
| 2020 | $5,801 | $382,900 | $75,300 | $307,600 |
| 2019 | $5,574 | $358,700 | $73,300 | $285,400 |
| 2018 | $4,927 | $306,800 | $73,300 | $233,500 |
| 2017 | $4,568 | $283,700 | $73,300 | $210,400 |
| 2016 | $4,720 | $271,900 | $71,200 | $200,700 |
| 2015 | $4,062 | $223,800 | $71,200 | $152,600 |
| 2014 | $4,228 | $233,200 | $71,200 | $162,000 |
Source: Public Records
Map
Nearby Homes