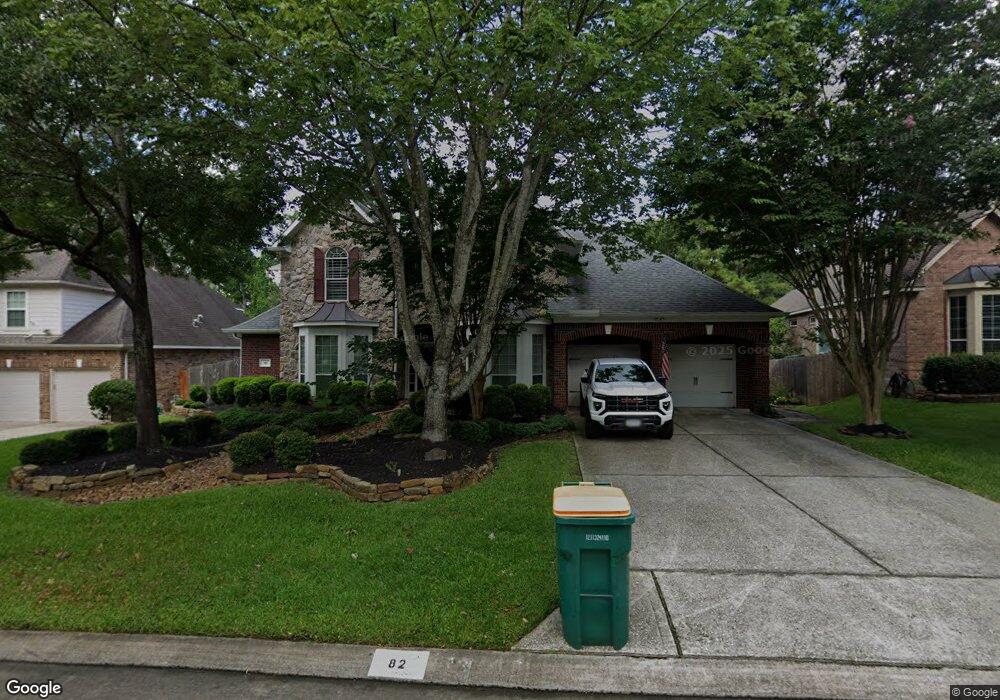
82 W Lansdowne Cir Spring, TX 77382
Indian Springs NeighborhoodEstimated Value: $969,000 - $1,109,000
Studio
1
Bath
3,950
Sq Ft
$257/Sq Ft
Est. Value
About This Home
This home is located at 82 W Lansdowne Cir, Spring, TX 77382 and is currently estimated at $1,013,192, approximately $256 per square foot. 82 W Lansdowne Cir is a home located in Montgomery County with nearby schools including Tough Elementary School, McCullough Junior High School, and The Woodlands High School.
Ownership History
Date
Name
Owned For
Owner Type
Purchase Details
Closed on
Jun 24, 2015
Sold by
Woods Robert F and Woods Deborah J
Bought by
Gopal Vikram and Ramanchandran Aarthi
Current Estimated Value
Home Financials for this Owner
Home Financials are based on the most recent Mortgage that was taken out on this home.
Original Mortgage
$417,000
Outstanding Balance
$324,811
Interest Rate
3.91%
Mortgage Type
Purchase Money Mortgage
Estimated Equity
$688,381
Purchase Details
Closed on
May 15, 2003
Sold by
D R Horton Emerald Ltd
Bought by
Woods Robert F and Woods Deborah J
Home Financials for this Owner
Home Financials are based on the most recent Mortgage that was taken out on this home.
Original Mortgage
$200,000
Interest Rate
5.84%
Mortgage Type
Purchase Money Mortgage
Purchase Details
Closed on
Nov 27, 2002
Sold by
The Woodlands Land Development Co Lp
Bought by
D R Horton Emerald Ltd
Create a Home Valuation Report for This Property
The Home Valuation Report is an in-depth analysis detailing your home's value as well as a comparison with similar homes in the area
Home Values in the Area
Average Home Value in this Area
Purchase History
| Date | Buyer | Sale Price | Title Company |
|---|---|---|---|
| Gopal Vikram | -- | Texas American Title Company | |
| Woods Robert F | -- | Travis Title Co | |
| D R Horton Emerald Ltd | -- | Travis Title Co |
Source: Public Records
Mortgage History
| Date | Status | Borrower | Loan Amount |
|---|---|---|---|
| Open | Gopal Vikram | $417,000 | |
| Previous Owner | Woods Robert F | $200,000 | |
| Closed | Woods Robert F | $125,000 |
Source: Public Records
Tax History
| Year | Tax Paid | Tax Assessment Tax Assessment Total Assessment is a certain percentage of the fair market value that is determined by local assessors to be the total taxable value of land and additions on the property. | Land | Improvement |
|---|---|---|---|---|
| 2025 | $12,055 | $858,979 | -- | -- |
| 2024 | $10,962 | $780,890 | -- | -- |
| 2023 | $10,962 | $709,900 | $120,000 | $705,970 |
| 2022 | $12,822 | $645,360 | $120,000 | $659,840 |
| 2021 | $12,508 | $586,690 | $60,000 | $526,690 |
| 2020 | $13,340 | $597,370 | $60,000 | $537,370 |
| 2019 | $12,945 | $561,210 | $60,000 | $501,210 |
| 2018 | $11,843 | $561,210 | $60,000 | $501,210 |
| 2017 | $13,945 | $596,980 | $60,000 | $536,980 |
| 2016 | $14,070 | $602,310 | $60,000 | $542,310 |
| 2015 | $12,717 | $574,220 | $60,000 | $514,220 |
| 2014 | $12,717 | $541,560 | $60,000 | $481,710 |
Source: Public Records
Map
Nearby Homes
- 187 E Lansdowne Cir
- 58 S Longsford Cir
- 22 W Bracebridge Cir
- 7 Stanwick Place
- 70 E Bracebridge Cir
- 15 Heather Bank Place
- 7318 Burr Oak Trace
- 137 Cheswood Manor Dr
- 170 N Hazelcrest Cir
- 98 E Beckonvale Cir
- 2 N Chantsong Cir
- 3 Farington Way
- 55 W Shale Creek Ct
- 54 Kingscote Way
- 35 Ledgestone Place
- 11 Scenic Brook Ct
- 7519 Red Bay Cir
- 22 Brywood Place
- 43 Philbrook Way
- 70 Lake Reverie Place
- 78 W Lansdowne Cir
- 86 W Lansdowne Cir
- 74 W Lansdowne Cir
- 90 W Lansdowne Cir
- 79 W Lansdowne Cir
- 87 W Lansdowne Cir
- 91 W Lansdowne Cir
- 67 W Lansdowne Cir
- 70 W Lansdowne Cir
- 94 N Lansdowne Cir
- 95 W Lansdowne Cir
- 27 Meadow Rose Place
- 95 Lansdown
- 55 N Lansdowne Cir
- 31 Meadow Rose Place
- 98 W Lansdowne Cir
- 23 Meadow Rose Place
- 99 W Lansdowne Cir
- 66 N Lansdowne Cir
- 62 N Lansdowne Cir
Your Personal Tour Guide
Ask me questions while you tour the home.