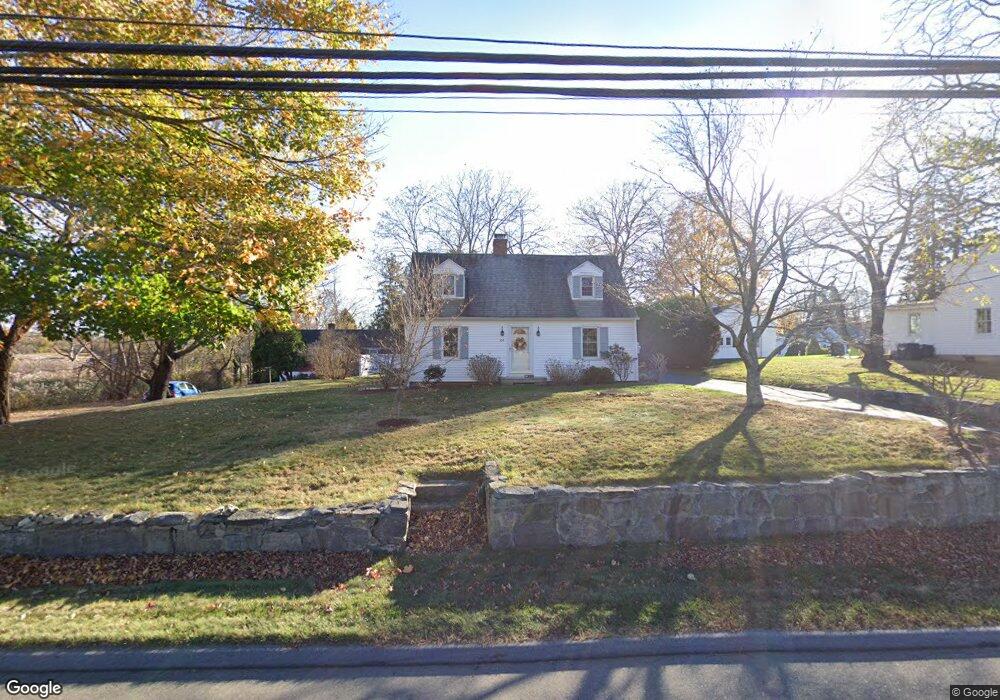
82 W Main St Niantic, CT 06357
Estimated Value: $377,045 - $434,000
3
Beds
1
Bath
1,163
Sq Ft
$344/Sq Ft
Est. Value
About This Home
This home is located at 82 W Main St, Niantic, CT 06357 and is currently estimated at $400,511, approximately $344 per square foot. 82 W Main St is a home located in New London County with nearby schools including East Lyme Middle School, East Lyme High School, and The Light House Voc-Ed Center.
Ownership History
Date
Name
Owned For
Owner Type
Purchase Details
Closed on
Mar 29, 2010
Sold by
Daniels Peter James
Bought by
Winzer Linda
Current Estimated Value
Home Financials for this Owner
Home Financials are based on the most recent Mortgage that was taken out on this home.
Original Mortgage
$221,408
Outstanding Balance
$147,611
Interest Rate
5.02%
Mortgage Type
Purchase Money Mortgage
Estimated Equity
$252,900
Create a Home Valuation Report for This Property
The Home Valuation Report is an in-depth analysis detailing your home's value as well as a comparison with similar homes in the area
Home Values in the Area
Average Home Value in this Area
Purchase History
| Date | Buyer | Sale Price | Title Company |
|---|---|---|---|
| Winzer Linda | $225,500 | -- | |
| Winzer Linda | $225,500 | -- |
Source: Public Records
Mortgage History
| Date | Status | Borrower | Loan Amount |
|---|---|---|---|
| Open | Winzer Linda | $221,408 | |
| Closed | Winzer Linda | $221,408 | |
| Previous Owner | Winzer Linda | $184,000 |
Source: Public Records
Tax History Compared to Growth
Tax History
| Year | Tax Paid | Tax Assessment Tax Assessment Total Assessment is a certain percentage of the fair market value that is determined by local assessors to be the total taxable value of land and additions on the property. | Land | Improvement |
|---|---|---|---|---|
| 2025 | $4,029 | $143,850 | $51,450 | $92,400 |
| 2024 | $3,790 | $143,850 | $51,450 | $92,400 |
| 2023 | $3,579 | $143,850 | $51,450 | $92,400 |
| 2022 | $3,429 | $143,850 | $51,450 | $92,400 |
| 2021 | $3,496 | $122,640 | $59,360 | $63,280 |
| 2020 | $3,478 | $122,640 | $59,360 | $63,280 |
| 2019 | $3,457 | $122,640 | $59,360 | $63,280 |
| 2018 | $3,354 | $122,640 | $59,360 | $63,280 |
| 2017 | $3,208 | $122,640 | $59,360 | $63,280 |
| 2016 | $2,821 | $111,230 | $51,450 | $59,780 |
| 2015 | $2,748 | $111,230 | $51,450 | $59,780 |
| 2014 | $2,673 | $111,230 | $51,450 | $59,780 |
Source: Public Records
Map
Nearby Homes
- 3 Sunnieside Dr
- 47 Village Crossing Unit 47
- 3 Village Crossing Unit 3
- 46 Village Crossing Unit 46
- 48 Village Crossing Unit 48
- 68-70 Black Point Rd
- 43 Village Crossing Unit 43
- 97 W Main St Unit 78
- 97 W Main St Unit 15
- 127 Black Point Rd Unit 11
- 20A Bush Hill Dr
- 78 Corey Ln Unit 9
- 146 Black Point Rd
- 150 Black Point Rd
- 66 Corey Ln
- 3 Pattagansett Ct
- 7 Old Black Point Rd
- 9 Columbus Ave
- 80 E Pattagansett Rd
- 94 Old Black Point Rd