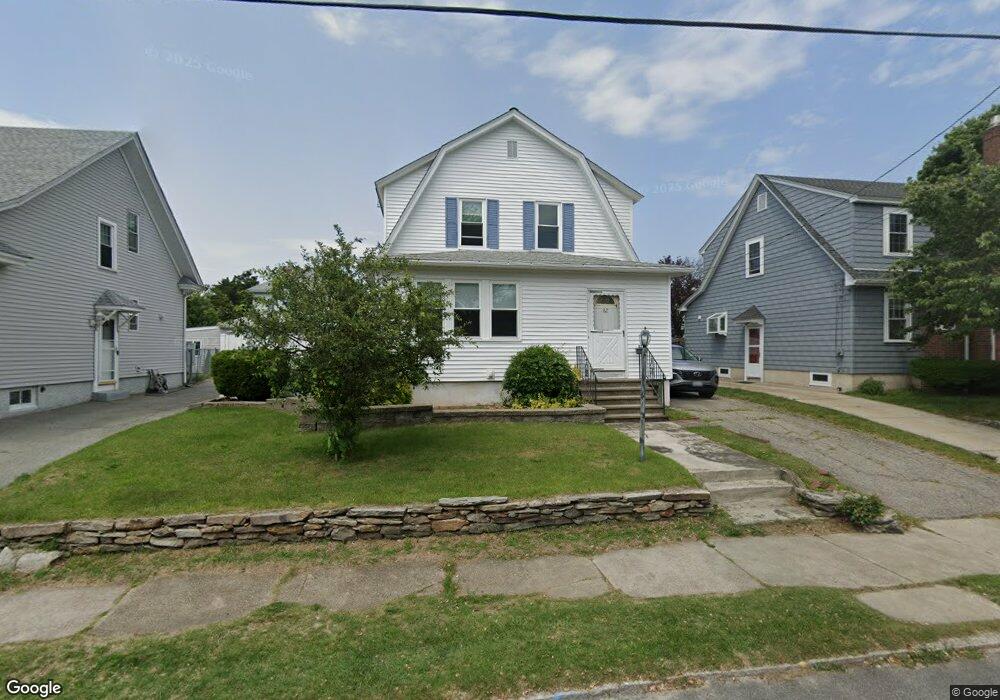
82 Welfare Ave Cranston, RI 02910
Estimated Value: $410,220 - $463,000
3
Beds
1
Bath
1,700
Sq Ft
$251/Sq Ft
Est. Value
About This Home
This home is located at 82 Welfare Ave, Cranston, RI 02910 and is currently estimated at $426,305, approximately $250 per square foot. 82 Welfare Ave is a home located in Providence County with nearby schools including W. R. Dutemple School, Park View Middle School, and Cranston High School East.
Ownership History
Date
Name
Owned For
Owner Type
Purchase Details
Closed on
Aug 22, 2014
Sold by
Eaton Scott A and Eaton Tammy M
Bought by
Eaton Tammy M
Current Estimated Value
Purchase Details
Closed on
Jul 15, 1997
Sold by
Wilson Paul R and Wilson Margaret
Bought by
Eaton Scott A and Eaton Tammy
Home Financials for this Owner
Home Financials are based on the most recent Mortgage that was taken out on this home.
Original Mortgage
$92,600
Interest Rate
7.86%
Create a Home Valuation Report for This Property
The Home Valuation Report is an in-depth analysis detailing your home's value as well as a comparison with similar homes in the area
Purchase History
We collect this data history from publicly available records. To have your information removed, we recommend requesting removal directly through your county’s website.
| Date | Buyer | Sale Price | Title Company |
|---|---|---|---|
| Eaton Tammy M | -- | -- | |
| Eaton Scott A | $98,000 | -- |
Source: Public Records
Mortgage History
We collect this data history from publicly available records. To have your information removed, we recommend requesting removal directly through your county’s website.
| Date | Status | Borrower | Loan Amount |
|---|---|---|---|
| Previous Owner | Eaton Scott A | $25,000 | |
| Previous Owner | Eaton Scott A | $92,600 |
Source: Public Records
Tax History
| Year | Tax Paid | Tax Assessment Tax Assessment Total Assessment is a certain percentage of the fair market value that is determined by local assessors to be the total taxable value of land and additions on the property. | Land | Improvement |
|---|---|---|---|---|
| 2025 | $4,827 | $347,800 | $107,500 | $240,300 |
| 2024 | $4,734 | $347,800 | $107,500 | $240,300 |
| 2023 | $4,661 | $246,600 | $70,800 | $175,800 |
| 2022 | $4,565 | $246,600 | $70,800 | $175,800 |
| 2021 | $4,439 | $246,600 | $70,800 | $175,800 |
| 2020 | $4,331 | $208,500 | $67,400 | $141,100 |
| 2019 | $4,331 | $208,500 | $67,400 | $141,100 |
| 2018 | $4,230 | $208,500 | $67,400 | $141,100 |
| 2017 | $4,377 | $190,800 | $60,700 | $130,100 |
| 2016 | $4,283 | $190,800 | $60,700 | $130,100 |
| 2015 | $4,283 | $190,800 | $60,700 | $130,100 |
| 2014 | $3,919 | $171,600 | $60,700 | $110,900 |
Source: Public Records
Map
Nearby Homes
- 93 Brandon Rd
- 89 Brandon Rd
- 139 Alexander St
- 85 Brandon Rd
- 98 Welfare Ave
- 149 Alexander St
- 86 Welfare Ave
- 79 Brandon Rd
- 140 Alexander St
- 131 Alexander St
- 92 Brandon Rd
- 86 Brandon Rd
- 76 Welfare Ave
- 100 Welfare Ave
- 105 Brandon Rd
- 130 Alexander St
- 102 Welfare Ave
- 80 Brandon Rd
- 72 Welfare Ave
- 107 Brandon Rd
Your Personal Tour Guide
Ask me questions while you tour the home.