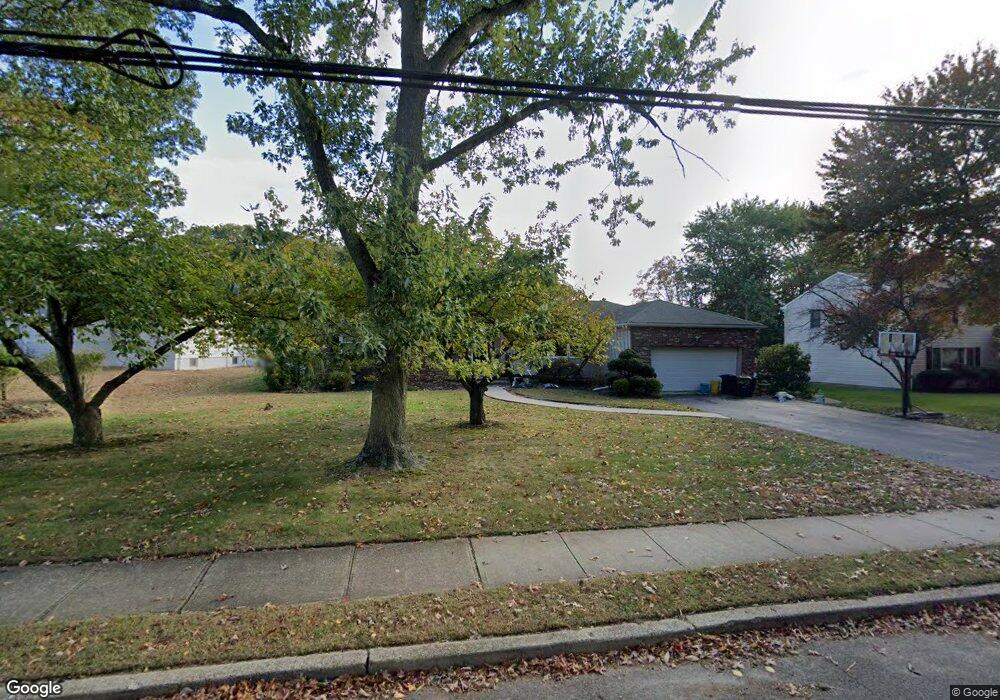
82 Whalepond Rd West Long Branch, NJ 07764
Estimated Value: $1,205,000 - $1,404,000
4
Beds
2
Baths
2,280
Sq Ft
$577/Sq Ft
Est. Value
About This Home
This home is located at 82 Whalepond Rd, West Long Branch, NJ 07764 and is currently estimated at $1,314,582, approximately $576 per square foot. 82 Whalepond Rd is a home located in Monmouth County with nearby schools including Betty McElmon Elementary School, Frank Antonides School, and Shore Regional High School.
Ownership History
Date
Name
Owned For
Owner Type
Purchase Details
Closed on
Jul 20, 2018
Sold by
Serrao John and Serrao Maria
Bought by
Serrao Maria
Current Estimated Value
Purchase Details
Closed on
Dec 4, 2003
Sold by
Landolfi Anthony
Bought by
Serrao John and Serrao Maria
Home Financials for this Owner
Home Financials are based on the most recent Mortgage that was taken out on this home.
Original Mortgage
$235,000
Interest Rate
5.82%
Create a Home Valuation Report for This Property
The Home Valuation Report is an in-depth analysis detailing your home's value as well as a comparison with similar homes in the area
Home Values in the Area
Average Home Value in this Area
Purchase History
| Date | Buyer | Sale Price | Title Company |
|---|---|---|---|
| Serrao Maria | -- | Sunrise Title Services | |
| Serrao John | $435,000 | -- |
Source: Public Records
Mortgage History
| Date | Status | Borrower | Loan Amount |
|---|---|---|---|
| Previous Owner | Serrao John | $235,000 |
Source: Public Records
Tax History Compared to Growth
Tax History
| Year | Tax Paid | Tax Assessment Tax Assessment Total Assessment is a certain percentage of the fair market value that is determined by local assessors to be the total taxable value of land and additions on the property. | Land | Improvement |
|---|---|---|---|---|
| 2025 | $15,497 | $1,247,200 | $790,500 | $456,700 |
| 2024 | $13,846 | $1,189,300 | $741,000 | $448,300 |
| 2023 | $13,846 | $991,100 | $601,300 | $389,800 |
| 2022 | $10,958 | $718,500 | $410,400 | $308,100 |
| 2021 | $10,958 | $566,900 | $315,400 | $251,500 |
| 2020 | $10,815 | $526,300 | $280,500 | $245,800 |
| 2019 | $10,625 | $519,800 | $275,400 | $244,400 |
| 2018 | $10,654 | $503,500 | $270,400 | $233,100 |
| 2017 | $10,389 | $468,800 | $242,900 | $225,900 |
| 2016 | $10,061 | $463,200 | $242,900 | $220,300 |
| 2015 | $9,685 | $445,300 | $247,900 | $197,400 |
| 2014 | $9,503 | $407,700 | $219,500 | $188,200 |
Source: Public Records
Map
Nearby Homes
- 78 Whalepond Rd
- 78 Whalepond Rd Unit A
- 5 Danbury Ct
- 2 Karen Ct
- 3 Danbury Ct
- 88 Whalepond Rd
- 178 Whalepond Rd
- 182 Whalepond Rd
- 70 Whalepond Rd
- 15 Karen Ct
- 1 Danbury Ct
- 4 Karen Ct
- 302A Whalepond Rd
- 13 Karen Ct
- 4 Heath St
- 1 Karen Ct
- 6 Karen Ct
- 68 Whalepond Rd
- 190 Whalepond Rd
- 190 Whalepond Rd Unit Winter