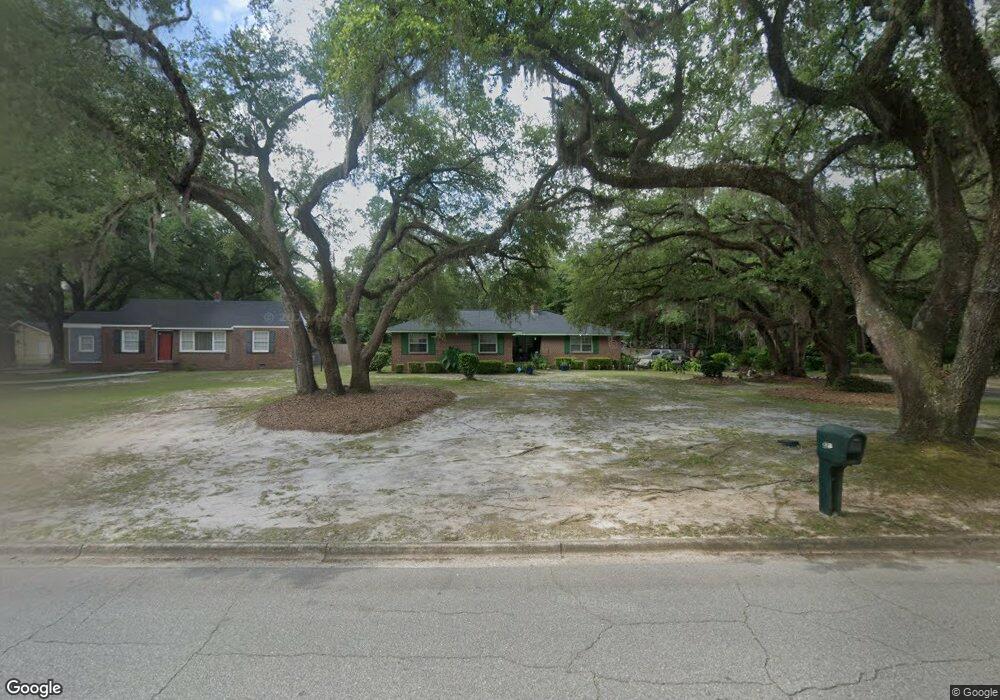
820 11th Ave Albany, GA 31701
Rawson Park NeighborhoodEstimated Value: $141,000 - $191,000
3
Beds
2
Baths
2,137
Sq Ft
$73/Sq Ft
Est. Value
About This Home
This home is located at 820 11th Ave, Albany, GA 31701 and is currently estimated at $155,419, approximately $72 per square foot. 820 11th Ave is a home located in Dougherty County with nearby schools including Northside Elementary School, Albany Middle School, and Dougherty Comprehensive High School.
Ownership History
Date
Name
Owned For
Owner Type
Purchase Details
Closed on
Sep 24, 2013
Sold by
Smith Anniece W Oliver
Bought by
Oliver Johnny
Current Estimated Value
Purchase Details
Closed on
Jul 22, 2013
Sold by
Oliver Johnny
Bought by
Smith Anniece Oliver
Purchase Details
Closed on
Apr 17, 2013
Sold by
Smith Anniece Oliver
Bought by
Oliver Johnn
Purchase Details
Closed on
Aug 11, 2009
Sold by
Smith Aaron
Bought by
Smith Anniece Oliver
Purchase Details
Closed on
Oct 30, 1997
Sold by
Albany City Of
Bought by
Smith Aaron and Anniece Oliver
Purchase Details
Closed on
Apr 16, 1996
Sold by
Greenway Joe
Bought by
Albany Ga City Of
Purchase Details
Closed on
Oct 1, 1966
Sold by
Reames Julian G
Bought by
Greenway Joe
Create a Home Valuation Report for This Property
The Home Valuation Report is an in-depth analysis detailing your home's value as well as a comparison with similar homes in the area
Home Values in the Area
Average Home Value in this Area
Purchase History
| Date | Buyer | Sale Price | Title Company |
|---|---|---|---|
| Oliver Johnny | -- | -- | |
| Smith Anniece Oliver | -- | -- | |
| Oliver Johnn | -- | -- | |
| Smith Anniece Oliver | -- | -- | |
| Smith Aaron | -- | -- | |
| Albany Ga City Of | $61,700 | -- | |
| Greenway Joe | -- | -- |
Source: Public Records
Tax History
| Year | Tax Paid | Tax Assessment Tax Assessment Total Assessment is a certain percentage of the fair market value that is determined by local assessors to be the total taxable value of land and additions on the property. | Land | Improvement |
|---|---|---|---|---|
| 2025 | $1,553 | $36,800 | $8,840 | $27,960 |
| 2024 | $1,553 | $36,800 | $8,840 | $27,960 |
| 2023 | $582 | $36,800 | $8,840 | $27,960 |
| 2022 | $1,425 | $36,800 | $8,840 | $27,960 |
| 2021 | $1,313 | $36,800 | $8,840 | $27,960 |
| 2020 | $1,316 | $36,800 | $8,840 | $27,960 |
| 2019 | $1,321 | $36,800 | $8,840 | $27,960 |
| 2018 | $1,326 | $36,800 | $8,840 | $27,960 |
| 2017 | $1,228 | $36,800 | $8,840 | $27,960 |
| 2016 | $1,503 | $36,800 | $8,840 | $27,960 |
| 2015 | $1,507 | $36,800 | $8,840 | $27,960 |
| 2014 | $1,570 | $38,832 | $9,320 | $29,512 |
Source: Public Records
Map
Nearby Homes
Your Personal Tour Guide
Ask me questions while you tour the home.