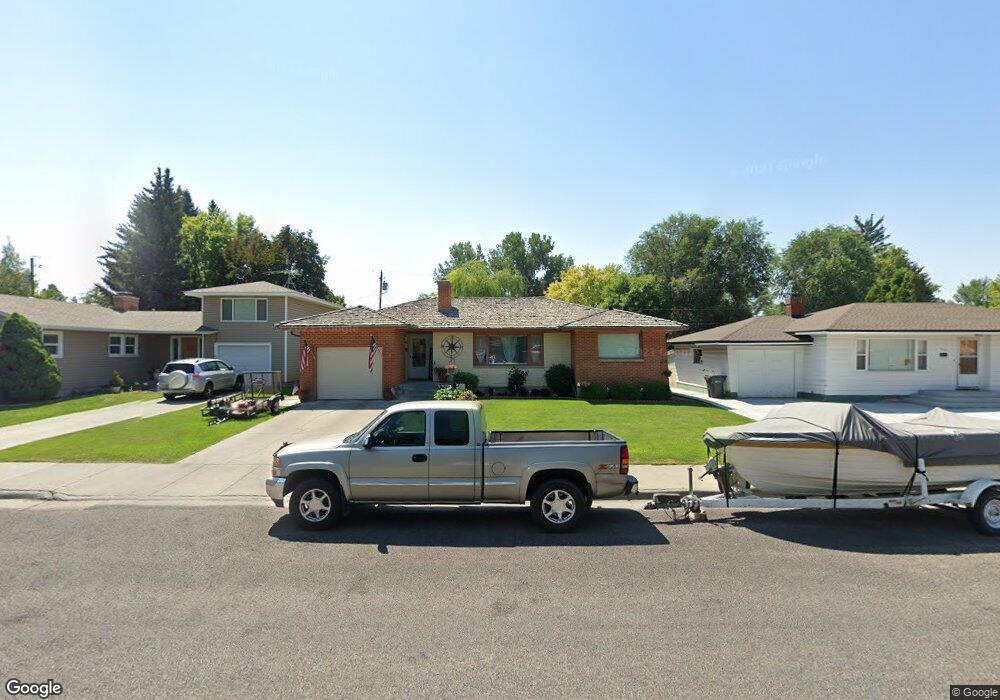
820 8th St Idaho Falls, ID 83401
Estimated Value: $319,000 - $345,000
4
Beds
2
Baths
2,718
Sq Ft
$124/Sq Ft
Est. Value
About This Home
This home is located at 820 8th St, Idaho Falls, ID 83401 and is currently estimated at $335,915, approximately $123 per square foot. 820 8th St is a home located in Bonneville County with nearby schools including Linden Park Elementary School, Taylorview Middle School, and Idaho Falls Senior High School.
Ownership History
Date
Name
Owned For
Owner Type
Purchase Details
Closed on
Jul 2, 2009
Sold by
Robison Ralph J and Robison Jan
Bought by
Weeman Pepper L and Weeman Stephen C
Current Estimated Value
Home Financials for this Owner
Home Financials are based on the most recent Mortgage that was taken out on this home.
Original Mortgage
$130,591
Outstanding Balance
$82,951
Interest Rate
4.79%
Mortgage Type
FHA
Estimated Equity
$252,964
Purchase Details
Closed on
Mar 28, 2007
Sold by
Staples Kelly and Staples Deanna
Bought by
Robison Ralph J
Create a Home Valuation Report for This Property
The Home Valuation Report is an in-depth analysis detailing your home's value as well as a comparison with similar homes in the area
Home Values in the Area
Average Home Value in this Area
Purchase History
| Date | Buyer | Sale Price | Title Company |
|---|---|---|---|
| Weeman Pepper L | -- | -- | |
| Robison Ralph J | -- | Alliance Title & Escrow Corp |
Source: Public Records
Mortgage History
| Date | Status | Borrower | Loan Amount |
|---|---|---|---|
| Open | Weeman Pepper L | $130,591 |
Source: Public Records
Tax History Compared to Growth
Tax History
| Year | Tax Paid | Tax Assessment Tax Assessment Total Assessment is a certain percentage of the fair market value that is determined by local assessors to be the total taxable value of land and additions on the property. | Land | Improvement |
|---|---|---|---|---|
| 2025 | $1,520 | $390,028 | $76,289 | $313,739 |
| 2024 | $1,520 | $350,748 | $52,584 | $298,164 |
| 2023 | $1,372 | $302,594 | $52,584 | $250,010 |
| 2022 | $1,779 | $266,018 | $33,718 | $232,300 |
| 2021 | $1,383 | $199,668 | $33,718 | $165,950 |
| 2019 | $1,567 | $184,370 | $28,090 | $156,280 |
| 2018 | $1,428 | $173,729 | $25,519 | $148,210 |
| 2017 | $1,294 | $150,024 | $18,564 | $131,460 |
| 2016 | $1,267 | $137,071 | $16,901 | $120,170 |
| 2015 | $1,188 | $125,120 | $16,901 | $108,219 |
| 2014 | $33,450 | $125,120 | $16,901 | $108,219 |
| 2013 | $1,103 | $119,577 | $16,900 | $102,677 |
Source: Public Records
Map
Nearby Homes