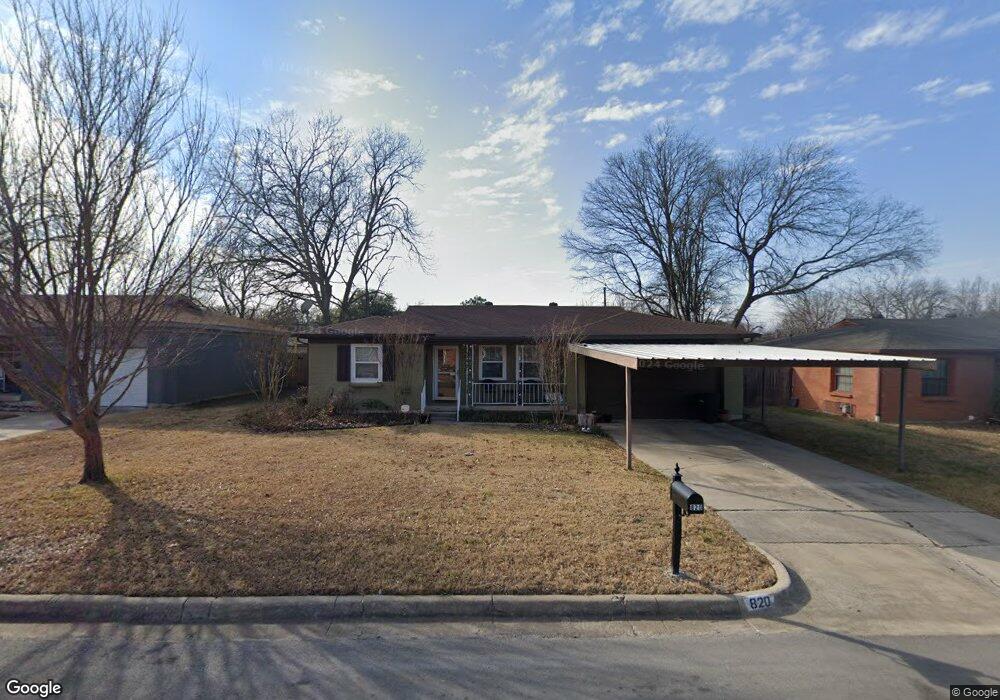
820 Ala Dr Fort Worth, TX 76108
Estimated Value: $204,000 - $224,000
3
Beds
1
Bath
1,197
Sq Ft
$180/Sq Ft
Est. Value
About This Home
This home is located at 820 Ala Dr, Fort Worth, TX 76108 and is currently estimated at $215,123, approximately $179 per square foot. 820 Ala Dr is a home located in Tarrant County with nearby schools including Liberty Elementary School, Brewer Middle School, and Tannahill Intermediate School.
Ownership History
Date
Name
Owned For
Owner Type
Purchase Details
Closed on
Aug 17, 2000
Sold by
Allen Gaylord K and Allen Eula Lee
Bought by
Summerville Michael A and Summerville Amy R
Current Estimated Value
Home Financials for this Owner
Home Financials are based on the most recent Mortgage that was taken out on this home.
Original Mortgage
$31,000
Interest Rate
8.15%
Purchase Details
Closed on
Apr 30, 1997
Sold by
Starr Judith Gail and Griggs Jewell Birdie
Bought by
Allen Gaylord K and Allen Eula Lee
Create a Home Valuation Report for This Property
The Home Valuation Report is an in-depth analysis detailing your home's value as well as a comparison with similar homes in the area
Home Values in the Area
Average Home Value in this Area
Purchase History
| Date | Buyer | Sale Price | Title Company |
|---|---|---|---|
| Summerville Michael A | -- | Commonwealth Land Title | |
| Summerville Michael A | -- | Commonwealth Land Title | |
| Allen Gaylord K | -- | Alamo Title Co |
Source: Public Records
Mortgage History
| Date | Status | Borrower | Loan Amount |
|---|---|---|---|
| Closed | Summerville Michael A | $31,000 |
Source: Public Records
Tax History Compared to Growth
Tax History
| Year | Tax Paid | Tax Assessment Tax Assessment Total Assessment is a certain percentage of the fair market value that is determined by local assessors to be the total taxable value of land and additions on the property. | Land | Improvement |
|---|---|---|---|---|
| 2025 | $834 | $199,380 | $43,980 | $155,400 |
| 2024 | $834 | $199,380 | $43,980 | $155,400 |
| 2023 | $3,557 | $209,791 | $43,980 | $165,811 |
| 2022 | $3,684 | $159,613 | $25,000 | $134,613 |
| 2021 | $3,401 | $145,669 | $25,000 | $120,669 |
| 2020 | $3,115 | $118,300 | $25,000 | $93,300 |
| 2019 | $2,940 | $115,662 | $25,000 | $90,662 |
| 2018 | $499 | $92,904 | $12,000 | $80,904 |
| 2017 | $2,468 | $88,642 | $12,000 | $76,642 |
| 2016 | $2,244 | $84,965 | $12,000 | $72,965 |
| 2015 | $418 | $69,800 | $10,000 | $59,800 |
| 2014 | $418 | $69,800 | $10,000 | $59,800 |
Source: Public Records
Map
Nearby Homes