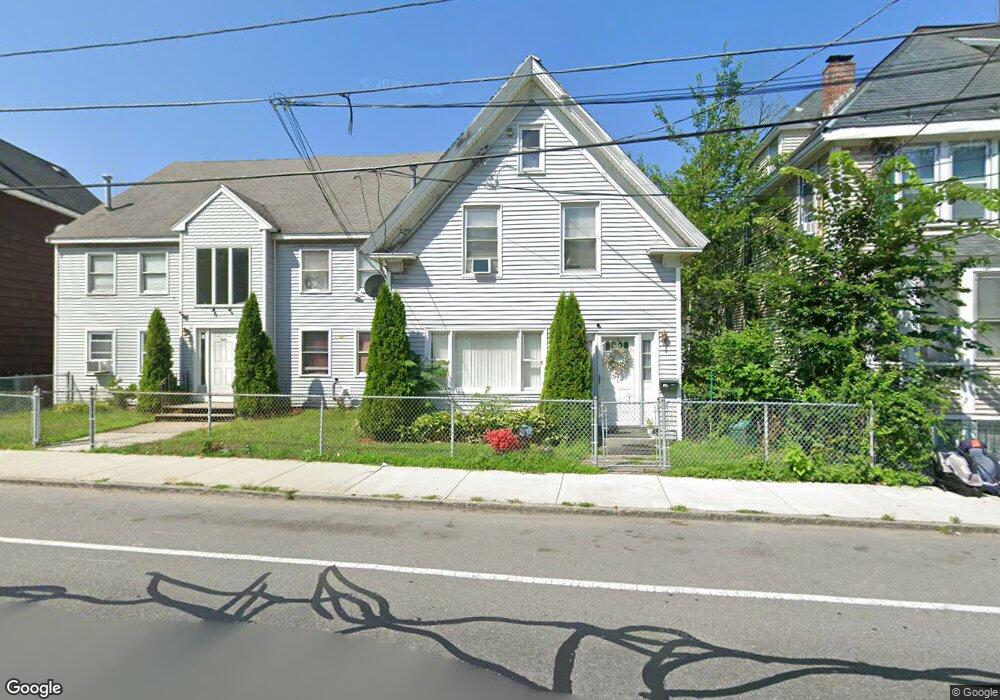
820 Bridge St Unit 5 Lowell, MA 01850
Centralville NeighborhoodEstimated Value: $250,000 - $299,000
2
Beds
1
Bath
859
Sq Ft
$312/Sq Ft
Est. Value
About This Home
This home is located at 820 Bridge St Unit 5, Lowell, MA 01850 and is currently estimated at $267,976, approximately $311 per square foot. 820 Bridge St Unit 5 is a home located in Middlesex County with nearby schools including S. Christa McAuliffe Elementary School, Greenhalge Elementary School, and Moody Elementary School.
Ownership History
Date
Name
Owned For
Owner Type
Purchase Details
Closed on
Jan 29, 2010
Sold by
Nomura Home Equity Inc
Bought by
Shen Delvin
Current Estimated Value
Purchase Details
Closed on
Apr 6, 2009
Sold by
Valkavitch Kevin E and Hsbc Bank Usa
Bought by
Hsbc Bank Usa
Purchase Details
Closed on
Jul 11, 2005
Sold by
Miller Alex
Bought by
Valkavitch Kevin E
Home Financials for this Owner
Home Financials are based on the most recent Mortgage that was taken out on this home.
Original Mortgage
$79,200
Interest Rate
5.71%
Mortgage Type
Purchase Money Mortgage
Purchase Details
Closed on
Mar 14, 2000
Sold by
Tessier David J and Tessier Ellen M
Bought by
Miller Alex
Purchase Details
Closed on
Oct 22, 1993
Sold by
Mercier Rlty Co
Bought by
Tessier David J and Tessier Ellen M
Create a Home Valuation Report for This Property
The Home Valuation Report is an in-depth analysis detailing your home's value as well as a comparison with similar homes in the area
Home Values in the Area
Average Home Value in this Area
Purchase History
| Date | Buyer | Sale Price | Title Company |
|---|---|---|---|
| Shen Delvin | $35,000 | -- | |
| Hsbc Bank Usa | $57,950 | -- | |
| Valkavitch Kevin E | $99,000 | -- | |
| Miller Alex | $35,500 | -- | |
| Tessier David J | $7,000 | -- |
Source: Public Records
Mortgage History
| Date | Status | Borrower | Loan Amount |
|---|---|---|---|
| Previous Owner | Valkavitch Kevin E | $79,200 | |
| Previous Owner | Tessier David J | $31,500 |
Source: Public Records
Tax History Compared to Growth
Tax History
| Year | Tax Paid | Tax Assessment Tax Assessment Total Assessment is a certain percentage of the fair market value that is determined by local assessors to be the total taxable value of land and additions on the property. | Land | Improvement |
|---|---|---|---|---|
| 2025 | $2,419 | $210,700 | $0 | $210,700 |
| 2024 | $2,275 | $191,000 | $0 | $191,000 |
| 2023 | $2,090 | $168,300 | $0 | $168,300 |
| 2022 | $1,294 | $102,000 | $0 | $102,000 |
| 2021 | $1,228 | $91,200 | $0 | $91,200 |
| 2020 | $1,178 | $88,200 | $0 | $88,200 |
| 2019 | $1,148 | $81,800 | $0 | $81,800 |
| 2018 | $1,078 | $74,900 | $0 | $74,900 |
| 2017 | $1,091 | $73,100 | $0 | $73,100 |
| 2016 | $1,031 | $68,000 | $0 | $68,000 |
| 2015 | $989 | $63,900 | $0 | $63,900 |
| 2013 | $1,093 | $72,800 | $0 | $72,800 |
Source: Public Records
Map
Nearby Homes
- 820 Bridge St Unit 4
- 820 Bridge St Unit 1
- 820 Bridge St Unit 6
- 820 Bridge St Unit 3
- 820 Bridge St Unit 2
- 806 Bridge St
- 25 Hildreth St
- 33 Hildreth St
- 824-838 Bridge St
- 824 Bridge St
- 37 Hildreth St
- 821 Bridge St
- 821 Bridge St Unit 3
- 821 Bridge St
- 821 Bridge St Unit 1
- 10 12th St
- 829 Bridge St
- 28 Hildreth St
- 24 Hildreth St
- 34 Hildreth St