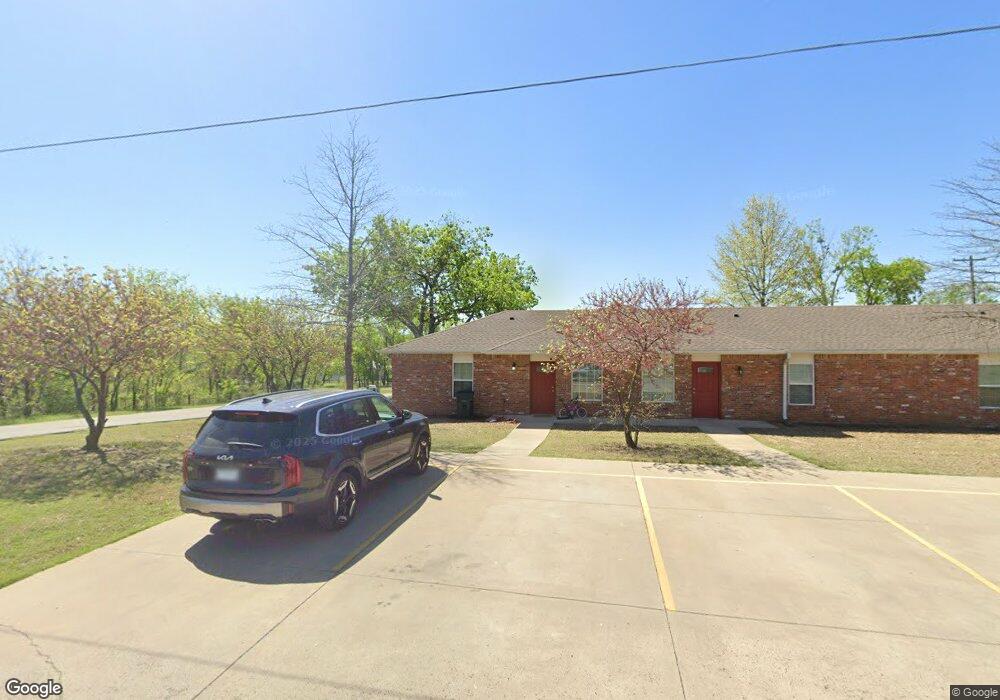
820 E Fife Ave Sapulpa, OK 74066
Estimated Value: $262,000 - $440,000
--
Bed
--
Bath
3,267
Sq Ft
$113/Sq Ft
Est. Value
About This Home
This home is located at 820 E Fife Ave, Sapulpa, OK 74066 and is currently estimated at $369,257, approximately $113 per square foot. 820 E Fife Ave is a home with nearby schools including Sapulpa Junior High School, Sapulpa Middle School, and Sapulpa High School.
Ownership History
Date
Name
Owned For
Owner Type
Purchase Details
Closed on
Feb 25, 2022
Sold by
Hersh Properties Llc
Bought by
Parks Todd and Parks Valerie
Current Estimated Value
Purchase Details
Closed on
Oct 7, 2016
Sold by
Schultz Philip and Schultz Kathryn
Bought by
Hersh Properties Llc
Home Financials for this Owner
Home Financials are based on the most recent Mortgage that was taken out on this home.
Original Mortgage
$336,840
Interest Rate
3.46%
Mortgage Type
Commercial
Purchase Details
Closed on
Jul 21, 2009
Sold by
Belk Troy and Belk Erin
Bought by
Schultz Philip
Purchase Details
Closed on
Dec 1, 2008
Sold by
Atchley Jones Irene Kay
Bought by
Belk Troy and Roberts Thomas
Purchase Details
Closed on
Oct 16, 2008
Sold by
Allen Sam T
Bought by
Belk Troy and Roberts Thomas
Purchase Details
Closed on
Mar 12, 2008
Sold by
Atchley Guy Earl and Atchley Linda
Bought by
Belk Troy and Roberts Thomas
Create a Home Valuation Report for This Property
The Home Valuation Report is an in-depth analysis detailing your home's value as well as a comparison with similar homes in the area
Home Values in the Area
Average Home Value in this Area
Purchase History
| Date | Buyer | Sale Price | Title Company |
|---|---|---|---|
| Parks Todd | $12,000 | None Listed On Document | |
| Hersh Properties Llc | $415,000 | None Available | |
| Schultz Philip | $21,000 | -- | |
| Belk Troy | $15,000 | -- | |
| Belk Troy | -- | -- | |
| Belk Troy | -- | -- |
Source: Public Records
Mortgage History
| Date | Status | Borrower | Loan Amount |
|---|---|---|---|
| Previous Owner | Hersh Properties Llc | $336,840 |
Source: Public Records
Tax History Compared to Growth
Tax History
| Year | Tax Paid | Tax Assessment Tax Assessment Total Assessment is a certain percentage of the fair market value that is determined by local assessors to be the total taxable value of land and additions on the property. | Land | Improvement |
|---|---|---|---|---|
| 2025 | $3,448 | $29,784 | $2,640 | $27,144 |
| 2024 | $3,448 | $28,366 | $2,640 | $25,726 |
| 2023 | $3,448 | $27,015 | $2,640 | $24,375 |
| 2022 | $2,955 | $25,729 | $2,640 | $23,089 |
| 2021 | $2,907 | $24,504 | $2,640 | $21,864 |
| 2020 | $2,753 | $23,337 | $2,640 | $20,697 |
| 2019 | $2,923 | $24,657 | $3,960 | $20,697 |
| 2018 | $2,984 | $24,657 | $3,960 | $20,697 |
| 2017 | $2,968 | $24,657 | $3,960 | $20,697 |
| 2016 | $3,160 | $27,609 | $3,960 | $23,649 |
| 2015 | -- | $27,609 | $3,960 | $23,649 |
| 2014 | -- | $27,081 | $3,711 | $23,370 |
Source: Public Records
Map
Nearby Homes
- 1002 E Line Ave
- 1137 E Watchorn Ave
- 1137 E Perkins Ave
- 1136 E Watchorn Ave
- 543 N Ridgeway St
- 1136 E Mcleod Ave
- 1140 E Hobson Ave
- 505 N Ross St
- 912 N Linden St
- 1001 E Thompson Ave
- 904 N 9th St
- 1023 E Thompson Ave
- 1033 E Thompson Ave
- 716 N 10th St
- 706 E Thompson Ave
- 0 Line Ave Unit 2546053
- 1010 E Thompson Ave
- 1411 E Denton Ave
- 720 N Main St
- 802 N Boyd Cir