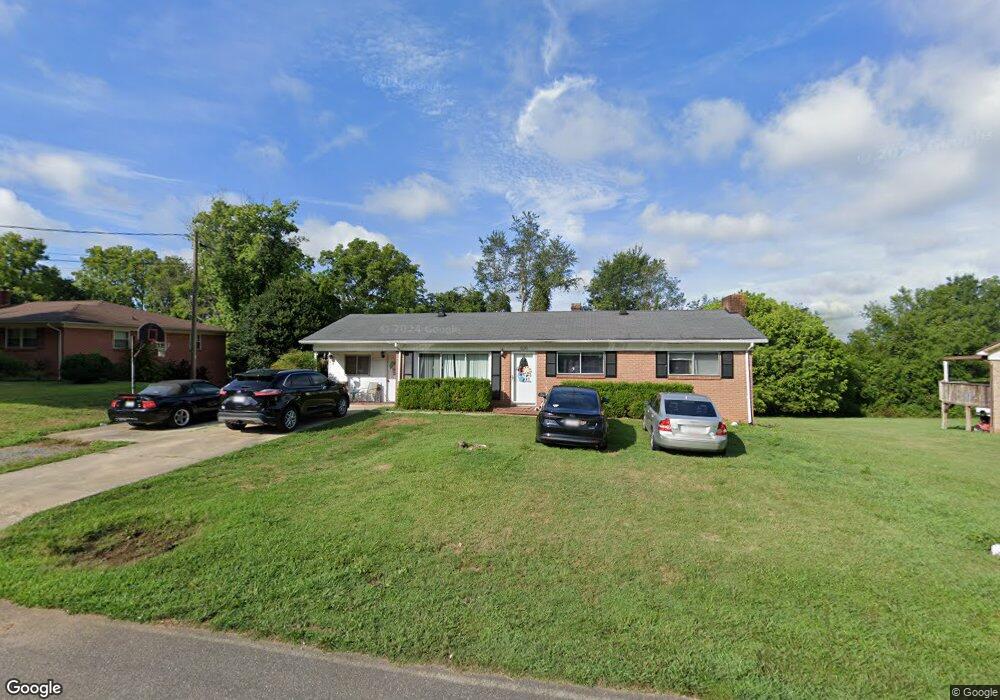
820 Emerald Place SW Lenoir, NC 28645
Estimated Value: $188,000 - $221,644
3
Beds
1
Bath
1,352
Sq Ft
$149/Sq Ft
Est. Value
About This Home
This home is located at 820 Emerald Place SW, Lenoir, NC 28645 and is currently estimated at $201,411, approximately $148 per square foot. 820 Emerald Place SW is a home located in Caldwell County with nearby schools including West Lenoir Elementary School, Gamewell Middle School, and West Caldwell High School.
Ownership History
Date
Name
Owned For
Owner Type
Purchase Details
Closed on
Mar 10, 2008
Sold by
Secretary Of Housing & Urban Development
Bought by
Riley Steven Ray and Riley Sarah N
Current Estimated Value
Home Financials for this Owner
Home Financials are based on the most recent Mortgage that was taken out on this home.
Original Mortgage
$76,023
Outstanding Balance
$47,055
Interest Rate
5.62%
Mortgage Type
FHA
Estimated Equity
$154,356
Purchase Details
Closed on
Oct 10, 2007
Sold by
Chase Home Finance Llc
Bought by
Secretary Of Hud
Purchase Details
Closed on
Jul 23, 2007
Sold by
White Danny E
Bought by
Chase Home Finance Llc
Purchase Details
Closed on
Oct 31, 2002
Sold by
Curtis Linda W
Bought by
White Danny E
Purchase Details
Closed on
Jul 16, 1999
Bought by
Curtis Linda W
Create a Home Valuation Report for This Property
The Home Valuation Report is an in-depth analysis detailing your home's value as well as a comparison with similar homes in the area
Home Values in the Area
Average Home Value in this Area
Purchase History
| Date | Buyer | Sale Price | Title Company |
|---|---|---|---|
| Riley Steven Ray | -- | None Available | |
| Secretary Of Hud | -- | None Available | |
| Chase Home Finance Llc | $91,014 | None Available | |
| White Danny E | $93,000 | -- | |
| Curtis Linda W | -- | -- |
Source: Public Records
Mortgage History
| Date | Status | Borrower | Loan Amount |
|---|---|---|---|
| Open | Riley Steven Ray | $76,023 |
Source: Public Records
Tax History Compared to Growth
Tax History
| Year | Tax Paid | Tax Assessment Tax Assessment Total Assessment is a certain percentage of the fair market value that is determined by local assessors to be the total taxable value of land and additions on the property. | Land | Improvement |
|---|---|---|---|---|
| 2025 | $672 | $176,800 | $12,700 | $164,100 |
| 2024 | $672 | $103,900 | $12,700 | $91,200 |
| 2023 | $672 | $103,900 | $12,700 | $91,200 |
| 2022 | $1,260 | $103,900 | $12,700 | $91,200 |
| 2021 | $1,260 | $103,900 | $12,700 | $91,200 |
| 2020 | $634 | $97,800 | $12,700 | $85,100 |
| 2019 | $634 | $97,800 | $12,700 | $85,100 |
| 2018 | $1,209 | $97,800 | $0 | $0 |
| 2017 | $1,209 | $97,800 | $0 | $0 |
| 2016 | $642 | $97,800 | $0 | $0 |
| 2015 | $1,119 | $97,800 | $0 | $0 |
| 2014 | $1,119 | $93,100 | $0 | $0 |
Source: Public Records
Map
Nearby Homes
- 931 Emerald Place SW
- 2308 Morganton Blvd SW
- 2326 Morganton Blvd SW
- 1164 Bradford Mountain Rd
- 2505 Morganton Blvd SW
- 133 Green Place
- 1375 Bradford Mountain Rd
- 2348 W Lenoir Dr
- 1419 Roy Dula Place SW
- 205 Abington Rd NW
- TBD Roy Dula Place
- 420 Virginia St SW
- 1607 Bradford St SW
- 1329 Overlook Dr SW
- 106 Virginia St SW
- 2696 Tablerock Rd
- 2334 Rainbow Heights Cir
- 2783 Shewcraft Place
- 2675 Tablerock Rd
- 2610 Tablerock Rd
- 822 Emerald Place SW
- 814 Emerald Place SW
- 819 Emerald Place SW
- 813 Emerald Place SW
- 810 Emerald Place SW
- 823 Emerald Place SW
- 828 Emerald Place SW
- 809 Emerald Place SW
- 821 Emerald Place SW
- 902 Emerald Place SW
- 901 Emerald Place SW
- 807 Emerald Place SW
- 810 Complex Place
- 908 Emerald Place SW
- 905 Emerald Place SW
- 912 Emerald Place SW
- 910 Emerald Place SW
- 913 Emerald Place SW
- 914 Emerald Place SW
- 919 Emerald Place SW